Sign in with Microsoft
Sign in or create an account.
Hello,
Select a different account.
You have multiple accounts
Choose the account you want to sign in with.

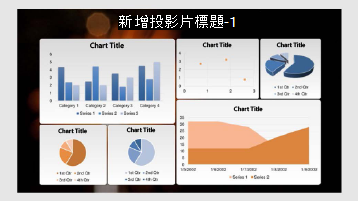
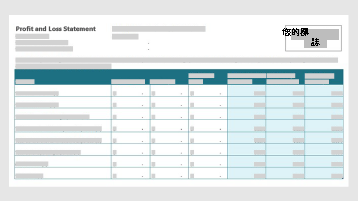
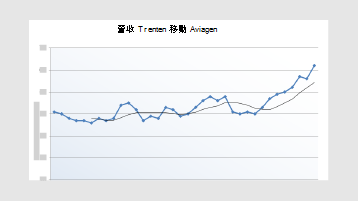
使用 Microsoft Excel 和 PowerPoint範本來追蹤、分析及視覺化您的現金流量、利潤、營收成長、市場共用和其他關鍵效能 指標

在 Excel 中追蹤及分析商務資料

使用這些範本開始使用:

損益範本

然後使用圖表、樞紐分析表和走勢圖來分析及視覺化您的資料。

需要協助嗎? 了解做法:

營收趨勢線圖表

使用 PowerPoint 視覺化您的資料

想要與您的小組分享資料、趨勢和商機嗎? 使用這些 PowerPoint 範本以視覺化的方式顯示您的資料:

資料儀表板範本

相關資源

Need more help?

Want more options?

探索訂閱權益、瀏覽訓練課程、瞭解如何保護您的裝置等等。

社群可協助您詢問並回答問題、提供意見反應,以及聆聽來自具有豐富知識的專家意見。

Was this information helpful?

How satisfied are you with the translation quality?
What affected your experience?
By pressing submit, your feedback will be used to improve Microsoft products and services. Your IT admin will be able to collect this data. Privacy Statement.

Thank you for your feedback!

×