You can change the style of an existing chart for a different look.
For most 2-D charts, you can change the chart type of the whole chart to give the chart a different look, or you can select a different chart type for any single data series, which turns the chart into a combination chart.

For bubble charts and all 3-D charts, you can only change the chart type of the whole chart.
Note: To complete this procedure, you must have an existing chart. For more information about how to create a chart, see Create a chart from start to finish.
-
Do one of the following:
-
To change the chart type of the whole chart, click the chart area or plot area of the chart to display the chart tools.
Tip: You can also right-click the chart area or plot area, click Change Chart Type, and then continue with step 3.
-
To change the chart type of a data series, click that data series.
Note: You can change the chart type of only one data series at a time. To change the chart type of more than one data series in the chart, repeat the steps of this procedure for each data series that you want to change.
This displays the Chart Tools, adding the Design, Layout, and Format tabs.
-
-
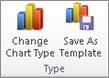
On the Design tab, in the Type group, click Change Chart Type.
-
In the Change Chart Type dialog box, click a chart type that you want to use.
The first box shows a list of chart type categories, and the second box shows the available chart types for each chart type category. For more information about the chart types that you can use, see Available chart types.
Tip: To use a chart type that you previously saved as a template, click Templates, and then click the chart template that you want to use.
Next steps
-
If the size of the chart no longer looks right, you can resize the chart (Chart Tools > Format tab > Size group).
-
To change the layout or style of the chart, see Change the layout or style of a chart.
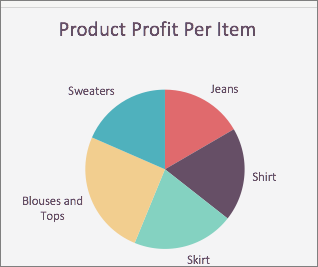
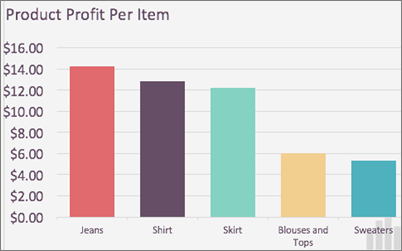
Let's say you have a clustered column chart type, but for your presentation, you would like to show a pie chart. You can change the type of chart you think would best represent your data at any time.
-
To change the Clustered Column to Pie, select your chart.
-
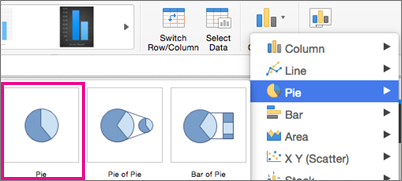
On the Chart Design tab, click Change Chart Type > Pie > Pie.
Your new chart type will show in your spreadsheet.