Sign in with Microsoft
Sign in or create an account.
Hello,
Select a different account.
You have multiple accounts
Choose the account you want to sign in with.

附註:  我們想要以您的語言,用最快的速度為您提供最新的說明內容。 本頁面是經由自動翻譯而成,因此文中可能有文法錯誤或不準確之處。讓這些內容對您有所幫助是我們的目的。希望您能在本頁底部告訴我們這項資訊是否有幫助。 此為 英文文章 出處,以供參考。

折線圖會適合用於顯示一段時間或其他連續資料資料。

Power View 中的折線圖

  1. 開始使用 Excel 活頁簿或包含資料的其他資料來源。

  2. 在 Power View 工作表中建立的表格:

    • 您要繪製包含值的欄位。

    • 日期/時間或其他連續的欄位。

  3. 資料表選取,在 [設計] 索引標籤上 > 線條。

[日期/時間] 欄位應在 [座標軸] 方塊和 [值] 方塊中的 [值] 欄位中。如果沒有,請將其移動 [欄位] 清單中。
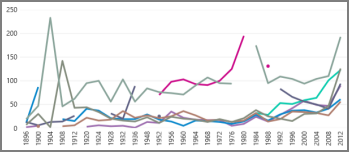
這是基本的折線圖。

其他資訊

Power View 中的圖表和其他視覺效果

Need more help?

Want more options?

探索訂閱權益、瀏覽訓練課程、瞭解如何保護您的裝置等等。

社群可協助您詢問並回答問題、提供意見反應,以及聆聽來自具有豐富知識的專家意見。

Was this information helpful?

How satisfied are you with the translation quality?
What affected your experience?
By pressing submit, your feedback will be used to improve Microsoft products and services. Your IT admin will be able to collect this data. Privacy Statement.

Thank you for your feedback!

×