
With Visio Professional, you can import data from external sources. The source of your data can be an Excel workbook, Access database, SQL Server database, SharePoint list, OLEDB source, or an ODBC source.
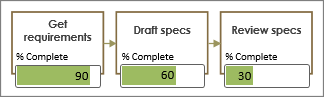
When data is imported, the diagram becomes more useful in many ways. In the following example data has been imported into a flowchart, and the data is visualized with progress bars. The bars show the current status of each step in the process. Therefore, the flowchart doesn’t solely show how the process should go. It also shows how the process is currently doing.
Visio also lets you refresh the imported data. With this ability, your diagram becomes less static, and is more like a live dashboard that you and your team can continually refer to.
How data gets linked in the diagram
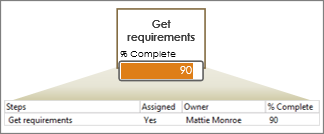
When you import data, a row of data gets linked (or associated) to a shape. You can specify which fields are shown on the shape. In the example below, a row has been associated with a flowchart shape, and the one field that is showing is the “% Complete field.” It is being visualized as a data bar, and the bar is filled up to 90%.
Data graphics
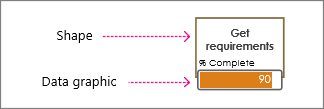
When data gets imported and linked to a shape, the data is displayed as a data graphic. A data graphic is a visualization of a data field. In the example below, the “Get requirements” shape has a data graphic showing the amount of work complete.
A data graphic could also be a colored flag that indicates a yes or no value like “On track” or “Not on track.” Or, a data graphic could simply be text placed on the shape acting as a label. There is also a way to color shapes by value.


