
Use a SmartArt graphic to create an org chart to show the reporting relationships in your organization.

-
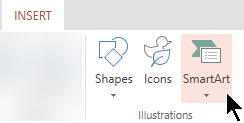
On the Insert tab, click Smart Art.
-
Under Hierarchy, select a chart layout.
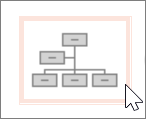
A default chart is added to the canvas with a text editor on its left border.
-
Use the text editor to assign labels to each box. The text editor contains a multi-level bullet list. Each bullet item represents a separate person in the org chart.
-
To change the hierarchy in the chart, select an item, and on the SmartArt tab, select the Promote or Demote option.

-
On the toolbar, use the SmartArt tab to apply a different style or color to your chart, as needed.


