
A SmartArt graphic is a visual representation of your information and ideas. You create one by choosing a layout that fits your message. Some layouts (such as organization charts and Venn diagrams) portray specific kinds of information, while others simply enhance the appearance of a bulleted list.
Combined with other features such as themes, SmartArt graphics help you create designer-quality illustrations with only a few clicks of your mouse.
In this article:
Overview of SmartArt graphics
You can create a SmartArt graphic in Excel, PowerPoint, Word, or in an email message in Outlook. The SmartArt button is on the Insert tab, and, depending on your screen size, may look like any of the following:


Other Office programs do not allow for SmartArt graphic creation, but you can copy and paste SmartArt graphics as images into those programs.
You can change the look of your SmartArt graphic by changing the fill of its shape or text; by adding effects, such as shadows, reflections, glows, or soft edges; or by adding three-dimensional (3-D) effects, such as bevels or rotations.
You can learn much more about working with SmartArt graphics by reading the related information listed at the bottom of this article.
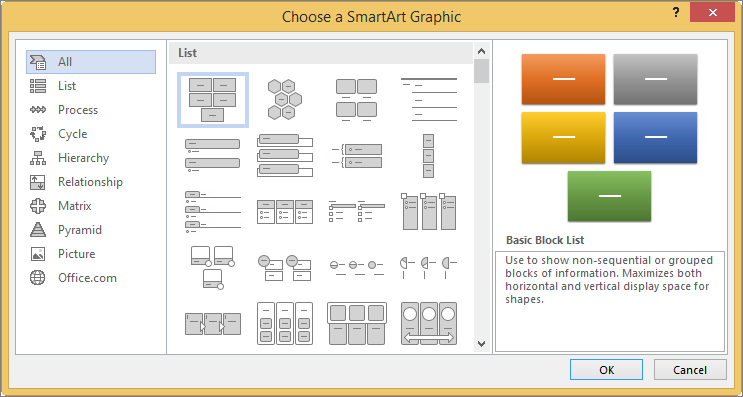
What to consider when choosing a layout
When you choose a layout for your SmartArt graphic, ask yourself what you want to convey and whether you want your information to appear a certain way. As part of this process, when you create a SmartArt graphic, you are prompted to choose a type such as Process, Hierarchy, or Relationship. A type is similar to a category of SmartArt graphic, and each type contains several different layouts.
Because you can quickly and easily switch layouts, try different layouts (from different types) until you find the one that best illustrates your message.
The table below lists examples of a few common uses for SmartArt graphics, and the best SmartArt types to consider for each use.
|
To do this |
Use this type |
|---|---|
|
Show non-sequential information. |
List |
|
Show steps in a process or timeline. |
Process |
|
Show a continual process. |
Cycle |
|
Create an organization chart. |
Hierarchy |
|
Show a decision tree. |
Hierarchy |
|
Illustrate connections. |
Relationship |
|
Show how parts relate to a whole. |
Matrix |
|
Use pictures to convey or accent content. |
Picture |
|
Show proportional relationships with the largest component on the top or bottom. |
Pyramid |
For more guidance on choosing the right SmartArt graphic layout, as well as more information about each layout type, see Choose a SmartArt graphic.
About the Text pane
Use the Text pane to enter and edit the text that appears in your SmartArt graphic. The Text pane appears to the left of your SmartArt graphic. As you add and edit your content in the Text pane, your SmartArt graphic is automatically updated — shapes are added or removed as needed.

When you create a SmartArt graphic, the SmartArt graphic and its Text pane are populated with placeholder text that you can replace with your information. At the top of the Text pane, you can edit the text that will appear in your SmartArt graphic. At the bottom of the Text pane, you can read a description of the SmartArt graphic.
In SmartArt graphics that contain a fixed number of shapes, only some of the text in the Text pane appears in your SmartArt graphic. Text, pictures, or other content that is not displayed is identified in the Text pane with a red X. This content is still available if you switch to another layout, but if you keep and close this same layout, the information is not saved, to protect your privacy.
The Text pane works like an outline or a bulleted list that maps information directly to your SmartArt graphic. Each SmartArt graphic defines its own mapping between the bullets in the Text pane and the set of shapes in the SmartArt graphic.
To create a new line of bulleted text in the Text pane, press Enter. To indent a line in the Text pane, select the line that you want to indent, and then under SmartArt Tools, on the Design tab, click Demote. To negatively indent a line, click Promote. You can also press Tab to indent or Shift+Tab to negatively indent from within the Text pane.
If you don't see the SmartArt Tools or Design tabs, double-click the SmartArt graphic.
Depending on the layout that you choose, each bullet in the Text pane is represented in the SmartArt graphic as either a new shape or a bullet inside a shape. For example, notice how the same text is mapped differently in the two SmartArt graphics below. In the first example, the sub-bullets are represented as separate shapes. In the second example, the sub-bullets are represented as bullets in the shape.

Tip: If you do not want all of your text in separate shapes, switch to a different layout that shows all of the text as bullets.
If you use an organization chart layout with an Assistant shape, a bullet with a line attached indicates the Assistant shape.
You can apply character formatting, such as font, font size, bold, italic, and underline, to the text in your SmartArt graphic by applying the formatting to text in the Text pane, and it is reflected in your SmartArt graphic. When the font size in one shape shrinks because you add more text to the shape, all of the other text in the remaining shapes of the SmartArt graphic will also shrink to the same size to keep the SmartArt graphic looking consistent and professional.
After you choose a layout, you can move your mouse pointer over any of the different layouts displayed on the Design tab, and use Live Preview to see what your content will look like with that layout applied.
Style, color, and effects for SmartArt graphics
Under SmartArt Tools, on the Design tab, there are two galleries for quickly changing the look of your SmartArt graphic: SmartArt Styles and Change Colors.
SmartArt Styles include shape fills, edges, shadows, line styles, gradients, and three-dimensional (3-D) perspectives and are applied to the entire SmartArt graphic. You can also apply an individual Shape style to one or more shapes in your SmartArt graphic.
The second gallery, Change Colors, provides a range of different color options for a SmartArt graphic, each one applying one or more theme colors in a different way to the shapes in your SmartArt graphic.
When you rest your pointer over a thumbnail in either of these galleries, you can preview how a SmartArt Style or color variation affects your SmartArt graphic before you actually apply it.
SmartArt Styles and color combinations are designed to underscore your content. For example, if you use a 3-D SmartArt Style with perspective, you can see everyone on the same level.
You can also use a 3-D SmartArt Style with perspective to emphasize a timeline that goes into the future.
Tip: 3-D SmartArt Styles, especially scene-coherent 3-D, are best used sparingly, to avoid distraction from the message that you want to convey. 3-D SmartArt Styles often work well for the first page of a document or the first slide of a presentation.
To emphasize distinct steps in a SmartArt graphic of the Process type, you can use any of the combinations under Colorful.

If you have a SmartArt graphic of the Cycle type, you can use any of the Accent options to emphasize the circular movement. These colors move along a gradient to the middle shape and then reverse to the first shape.

When choosing colors, you should also consider whether you want your audience to print your SmartArt graphic or view it online.
Tip: If an image is part of your background slide, color combinations with Transparent in the name work best to show off a more refined design in your document.
When you insert a SmartArt graphic into your document without specifying a theme, the graphic theme matches that used by the rest of the content in your document. If you change the theme of the document, the look of the SmartArt graphic is updated automatically.
Almost all parts of a SmartArt graphic are customizable. If the SmartArt Style gallery does not have the combination of fills, lines, and effects you want, you can apply an individual Shape style or fully customize the shape yourself. You can also move shapes around and resize them. You can find most of the customization options under SmartArt Tools on the Format tab.
Even after you customize your SmartArt graphic, you can change to a different layout, and most of your customizations will be kept. Or to remove all formatting and start over, on the Design tab, in the Reset group, click Reset Graphic.

Animation for SmartArt graphics
In PowerPoint, you can add animation to your SmartArt graphic, or to an individual shape in a SmartArt graphic. For example, you can make a shape fly in quickly from one side of your screen or slowly fade in.
The animations that are available depend on the layout that you choose for your SmartArt graphic, but you can always animate all of the shapes at once or one shape at time.
Learn more about animation by reading Animate your SmartArt graphic.
See Also
Restore the default layout and color of your SmartArt graphic


