
You can use a data flow diagram in Visio to document the logical flow of data through a set of processes or procedures. Visio lets you include external sources and destinations for the data, activities that transform the data, and stores or collections where the data is held.
Start a data flow diagram
-
Select File > New.
-
In the Search box, enter data flow diagram, and then press Enter.
-
In the search results, select the Data Flow Diagram template, and then select Create.
A new, blank diagram opens and the Shapes window shows a stencil of data flow shapes.
-
From the Data Flow Diagram Shapes stencil, drag an External interactor shape onto the drawing page to represent each external source or destination for data.
-
Drag more shapes onto the page to represent the processes, states, or entities involved in the data flow you are documenting.
-
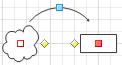
Indicate the flow of data in your diagram with Center to center shapes and indicate data loops using Loop on center shapes.
Indicate data flow between objects
-
From Data Flow Diagram Shapes, drag a Center to center shape onto the drawing page. Place it near the two shapes between which you want to show the flow of data.
-
To change the direction of the arrow, select the arrow, and then on the Home tab, in the Arrange group, click Position. Point to Rotate Shapes, and then click Flip Horizontal or Flip Vertical.
-
Drag the endpoints of the Center to center shape to the connection points

-
To change the arrow curvature, drag the selection handle


Indicate a data loop
-
From Data Flow Diagram Shapes, drag a Loop on center shape onto the drawing page near the place where you want to indicate a data loop.
-
Drag the begin point of the Loop on center shape to the center of the state or process shape that has the data loop. The endpoint turns red to indicate that the shapes are connected.
-
To change the size or position of the loop, drag the end point. To change the location of the ends of the loop, drag the control handle


