Sign in with Microsoft
Sign in or create an account.
Hello,
Select a different account.
You have multiple accounts
Choose the account you want to sign in with.

Maybe you’ve created a chart and think “this needs a little something else” to make it more impactful. Here’s where Chart Styles Customize the Look of Your Chart button is useful. Click the chart, click Customize the Look of Your Chart button , located next to the chart in the upper right corner, and pick an option in the Style or Color galleries.

Change the color of a chart

  1. Click the chart you want to change.

  2. In the upper right corner, next to the chart, click Chart Styles Customize the Look of Your Chart button .

  3. Click Color and pick the color scheme you want.

    Color tab in Customize the Look of Your Chart pane

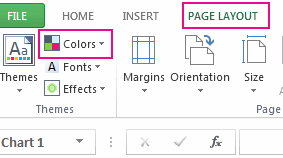
Tip: Chart styles (combinations of formatting options and chart layouts) use the theme colors. To change color schemes, switch to a different theme. In Excel, click Page Layout, click the Colors button, and then pick the color scheme you want or create your own theme colors.

Color button in Theme group on Page Layout tab

Change the chart style

  1. Click the chart you want to change.

  2. In the upper right corner next to the chart, click Chart Styles Customize the Look of Your Chart button .

  3. Click Style and pick the option you want.

Customize the Look of Your Chart Style pane

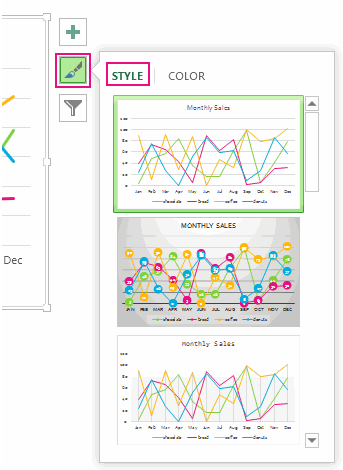
As you scroll down the gallery, Live Preview shows you how your chart data will look with the currently selected style.

Need more help?

Want more options?

Explore subscription benefits, browse training courses, learn how to secure your device, and more.

Communities help you ask and answer questions, give feedback, and hear from experts with rich knowledge.

Was this information helpful?

What affected your experience?
By pressing submit, your feedback will be used to improve Microsoft products and services. Your IT admin will be able to collect this data. Privacy Statement.

Thank you for your feedback!

×