
|
|
When you want to make sense of large amounts of data—whether it’s in your worksheet or accessible someplace else—Excel gives you powerful tools. You can analyze data in one or multiple tables, and create interactive and visual reports you can share with your stakeholders. |
Tips before you start
-
Let Excel recommend a PivotTable To quickly show the data you want to analyze in Excel, start by picking a PivotTable in a layout that Excel recommends for your data.
-
Analyze data in multiple tables You can analyze data from more than one table in your PivotTable report in Excel, even if you don’t use Power Pivot. The Data Model functionality is built into Excel. Just add data in multiple tables in Excel and then create relationships between them in a PivotTable or Power View sheet. Voila! You now have a Data Model to add more power to your data analysis.
-
Plot your data directly into an interactive PivotChart In Excel, you can create a standalone (decoupled) PivotChart that lets you interact with and filter data right in the chart.
-
Tap into the full power of Power Pivot and Power View If you’ve got Office ProPlus installed, try taking advantage of these powerful add-ins:
-
A built-in Data Model might be all you need to analyze data in multiple tables, but Power Pivot helps you create a sophisticated data model in a separate Power Pivot window. There are a few differences you might want to compare before you get started.
-
Power View helps you turn your Power Pivot data (or any other Excel data in a table) into a powerful interactive report that looks professional. Just click the Power View button on the Insert tab to get started.
-
Create a PivotTable or PivotChart
|
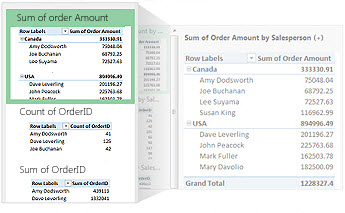
Make better business decisions by looking at your data from different angles in a PivotTable report. Excel helps you get started by recommending one that works for your data. |
|
|---|---|
|
When the data you want to explore is stored in another file outside of Excel, like an Access database or Online Analytical Processing (OLAP) cube file, you can connect to that external data source to analyze its data in a PivotTable report. |
|
|
If you want to analyze data in multiple tables, you can do that in Excel. Learn about different ways to create relationships between multiple tables in a PivotTable report for powerful data analysis. Behind the scenes, Excel creates a Data Model. |
|
|
Before you start out on your own, it might be helpful to follow the instructions in this tutorial to build a sample PivotTable in Excel that combines data from multiple tables into a Data Model. |
|
|
After you create a PivotTable based on worksheet data, external data, or multiple tables, you can access the Field List to add, arrange, and remove fields in your PivotTable report at any time. |
|
|
For a visual presentation, you can create a PivotChart with interactive filtering controls so you can analyze a subset of your data. Excel can even recommend a PivotChart for your data. If you just want an interactive chart, you don’t need to create a PivotTable first. |
|
|
When you want to delete a PivotTable, the trick is to select the entire PivotTable before you press Delete, even when it has a lot of data—this article provides a quick way to select an entire PivotTable. |
Change the format of your PivotTable
|
After you create a PivotTable and add the fields you want, you can change the layout to make the PivotTable easier to read and scan. Just choose a different report layout for instant layout changes. |
|
|---|---|
|
If you don’t like the look of your PivotTable after you create it, you can pick a different style. For example, when you have a lot of data in your PivotTable, it may help to show banded rows or columns for easy scanning or to highlight important data to make it stand out. |
Show PivotTable details
|
Sorting helps you organize large amounts of PivotTable data so it’s easier to find the items you want to analyze. You can sort data in alphabetical order or from highest to lowest values (or vice versa). |
|
|---|---|
|
To focus on a smaller portion of a large amount of your PivotTable data for in-depth analysis, you can filter the data. There are several ways to do that. For example, inserting one or more slicers gives you a quick and effective way to filter your data. |
|
|
Grouping data in a PivotTable can help you see a subset of the data you want to analyze. |
|
|
Drilling into large amounts of data in a PivotTable hierarchy has always been a time-consuming task with lots of expanding, collapsing, and filtering. In Excel, the new Quick Explore feature lets you drill into your OLAP cube or Data Model-based PivotTable hierarchy to analyze data details on different levels. Quick Explore helps you navigate to the data you want to see, and acts like a filter when you drill down. The button shows up whenever you select an item in a field. |
|
|
Instead of playing around with filters to show dates, you can now use a PivotTable timeline. Add a timeline to your PivotTable, filter by time, and zoom in on the period you want. |
Calculate PivotTable values
|
In a PivotTable, subtotals are calculated automatically and shown by default. But if you don’t see them, you can add them. You might also want to know how to calculate a percentage for subtotals, or hide subtotals and totals to remove them. |
|
|---|---|
|
To summarize values in a PivotTable, use functions like Sum, Count, and Average. Summary functions aren’t available in PivotTables that are based on OLAP source data. |
Change or update PivotTable data
|
After creating a PivotTable, you might want to change the source data it’s analyzing—for example, to include more or less data. |
|
|---|---|
|
When a PivotTable is connected to external data, refresh it from time to time to keep your PivotTable data up to date. |
Tap into the power of Power Pivot
|
If you’ve got Office Professional Plus installed, start the Power Pivot add-in that comes with Excel to perform powerful data analysis. Then use the Power Pivot window to create a sophisticated Data Model. |
|
|---|---|
|
Import multiple tables of sample data at the same time in this tutorial. In the second half of this tutorial, you’ll work with the Data Model in the Power Pivot window. |
|
|
Try importing relational data in the Power Pivot window as a fast and efficient alternative to importing or connecting to data in Excel. |
|
|
Power up your data analysis by creating relationships between different tables that have matching data, like a similar ID field. Table relationships let you build PivotTable reports that use fields from each table, even when the tables came from different sources. |
|
|
Solve data analysis and modeling problems in Power Pivot by using calculations such as AutoSum, calculated column and calculated field formulas, or custom Data Analysis Expressions (DAX) formulas. |
|
|
Use Power Pivot to create key performance indicators (KPIs) you can add to your PivotTables. |
|
|
This tutorial shows you how to make changes in your Data Model to enhance Power View reports. |
Explore your data with Power View
|
Use Power View (which comes installed with Office Professional Plus) to create interactive charts and other visualizations in separate, dashboard-like Power View sheets you can present to your stakeholders. At the end of Tutorial: Import Data into Excel, and Create a Data Model, you’ll get some helpful instructions for optimizing your Power Pivot data for Power View. |
|
|---|---|
|
Watch these videos to learn what Power View can do for you with Power Pivot in a supporting role. |
-
Create a PivotTable to analyze worksheet data Make better business decisions by looking at your data from different angles in a PivotTable report. Excel helps you get started by recommending one that works for your data.
-
Create a PivotChart For a visual presentation, you can create a PivotChart with interactive filtering controls so you can analyze a subset of your data. Excel can even recommend a PivotChart for your data. If you just want an interactive chart, you don’t need to create a PivotTable first.
-
Sort data in a PivotTable Sorting helps you organize large amounts of PivotTable data so it’s easier to find the items you want to analyze. You can sort data in alphabetical order or from highest to lowest values (or vice versa).
-
Filter data in a PivotTable To focus on a smaller portion of a large amount of your PivotTable data for in-depth analysis, you can filter the data. There are several ways to do that. For example, inserting one or more slicers gives you a quick and effective way to filter your data.
-
Use a PivotTable timeline to filter dates Instead of playing around with filters to show dates, you can now use a PivotTable timeline. Add a timeline to your PivotTable, filter by time, and zoom in on the period you want.
-
Show or hide subtotals in a PivotTable In a PivotTable, subtotals are calculated automatically and shown by default. But if you don’t see them, you can add them.
-
Use an external data source for a PivotTable After creating a PivotTable, you might want to change the source data it’s analyzing—for example, to include more or less data.


