
To change how the slices in a pie chart are arranged, you rotate it. You can do this with pie, 3-D pie, and doughnut charts in Microsoft Excel, or with an Excel chart you've copied to PowerPoint, Word, or Outlook.
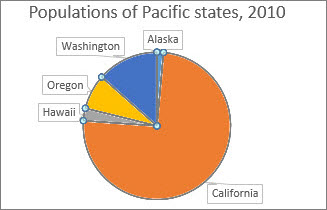
For example, in this chart, a couple of the state labels are wedged in under the title. Shifting the pie clockwise can fix that, and also reposition California to emphasize how big a piece of the pie its population is compared to the other four states. As a bonus, California's label becomes more visible. So, let's shift the pie clockwise one third of a circle, or 120 degrees.
-
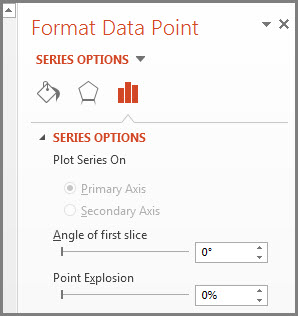
Right-click any slice of the pie chart > Format Data Series.
-
In the Format Data Point pane in the Angle of first slice box, replace 0 with 120 and press Enter.
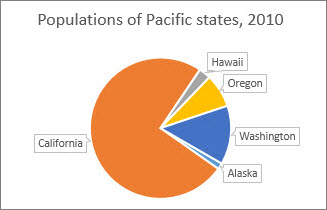
Now, the pie chart looks like this:
If you want to rotate another type of chart, such as a bar or column chart, you simply change the chart type to the style that you want. For example, to rotate a column chart, you would change it to a bar chart. Select the chart, click the Chart Tools Design tab, and then click Change Chart Type.


