
This QuickStart is for users new to Power Pivot in Excel or tabular model projects authored in SQL Server Data Tools. It is meant to give you a quick and easy introduction on how you can use Data Analysis Expressions (DAX) to solve a number of basic data modeling and analytical problems. This topic includes conceptual information, a series of tasks you can complete, and a few quizzes to test what you’ve learned. After completing this topic, you should have a good understanding of the most basic fundamental concepts in DAX.
What is DAX?
DAX is a collection of functions, operators, and constants that can be used in a formula, or expression, to calculate and return one or more values. Stated more simply, DAX helps you create new information from data already in your model.
Why is DAX so important?
It’s easy to create a workbook and import some data into it. You can even create PivotTables or PivotCharts that display important information without using any DAX formulas. But, what if you need to analyze critical sales data across several product categories and for different date ranges? Or, you need combine important inventory data from several tables in different data sources? DAX formulas provide this capability and many other important capabilities as well. Learning how to create effective DAX formulas will help you get the most out of your data. When you get the information you need, you can begin to solve real business problems that affect your bottom line. This is Business Intelligence, and DAX will help you get there.
Prerequisites
You might already be familiar with creating formulas in Microsoft Excel. That knowledge will be helpful in understanding DAX, but even if you have no experience with Excel formulas, the concepts described here will help you get started creating DAX formulas and solving real-world BI problems right away.
We are going to focus specifically on understanding DAX formulas used in calculations. You should already be familiar with fundamental concepts of both calculated columns and measures (also known as calculated fields), both of which are described in Power Pivot Help. You should also be familiar with the Power Pivot in Excel authoring environment and tools.
Example Workbook
The best way to learn DAX is to create some basic formulas, use it with some actual data, and see the results for yourself. The examples and tasks here use the Contoso Sample DAX Formulas.xlsx workbook. You can download the workbook from http://go.microsoft.com/fwlink/?LinkID=237472&clcid=0x409. Once you have the workbook downloaded onto your computer, open it, and then open the Power Pivot window.
Let’s Begin!
We will frame DAX around three very important fundamental concepts: Syntax, Functions, and Context. Of course, there are other important concepts in DAX, but understanding these three concepts will provide the best foundation on which to build your DAX skills.
Syntax
Before you create your own formulas, let’s take a look at DAX formula syntax. Syntax includes the various elements that make up a formula, or more simply, how the formula is written. For example, let’s look at a simple DAX formula used to create new data (values) for each row in a calculated column, named Margin, in a FactSales table: (formula text colors are for illustrative purposes only)
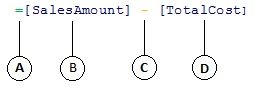
This formula’s syntax includes the following elements:
-
The equals sign operator (=) indicates the beginning of the formula, and when this formula is calculated it will return a result or value. All formulas that calculate a value will begin with an equals sign.
-
The referenced column [SalesAmount] contains the values we want to subtract from. A column reference in a formula is always surrounded by brackets []. Unlike Excel formulas which reference a cell, a DAX formula always references a column.
-
The subtraction (-) mathematical operator.
-
The referenced column [TotalCost] contains the values we want to subtract from values in the [SalesAmount] column.
When trying to understand how to read a DAX formula, it is often helpful to break down each of the elements into a language you think and speak every day. For example, you can read this formula as:
In the FactSales table, for each row in the Margin calculated column, calculate (=) a value by subtracting (-) values in the [ TotalCost ] column from values in the [ SalesAmount ] column.
Let’s take a look at another type of formula, one that is used in a measure:
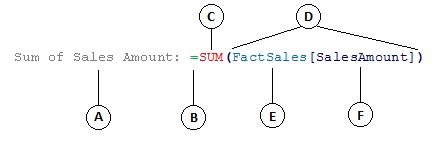
This formula includes the following syntax elements:
-
The measure name Sum of Sales Amount. Formulas for measures can include the measure name, followed by a colon, followed by the calculation formula.
-
The equals sign operator (=) indicates the beginning of the calculation formula. When calculated, it will return a result.
-
The function SUM adds up all of the numbers in the [SalesAmount] column. You will learn more about functions later.
-
Parenthesis () surround one or more arguments. All functions require at least one argument. An argument passes a value to a function.
-
The referenced table FactSales.
-
The referenced column [SalesAmount] in the FactSales table. With this argument, the SUM function knows on which column to aggregate a SUM.
You can read this formula as:
For the measure named Sum of Sales Amount, calculate (=) the SUM of values in the [ SalesAmount ] column in the FactSales table.
When placed into the Values drop zone in a PivotTable Field List, this measure calculates and returns values defined by each cell in the PivotTable, for example, Cell Phones in the USA.
Notice there are a few things different about this formula compared to the formula we used for the Margin calculated column. In particular, we introduced a function, SUM. Functions are pre-written formulas that make it easier to do complex calculations and manipulations with numbers, dates, time, text, and more. You will learn more about functions later.
Unlike the Margin calculated column earlier, you see the column [SalesAmount] was preceded by the table FactSales in which the column belongs. This is known as a fully qualified column name in that it includes the column name preceded by the table name. Columns referenced in the same table do not require the table name be included in the formula. This can make long formulas that reference many columns shorter and easier to read. However, it is good practice to always include the table name in your measure formulas, even when in the same table.
Note: If the name of a table contains spaces, reserved keywords, or disallowed characters, you must enclose the table name in single quotation marks. You must also enclose table names in quotation marks if the name contains any characters outside the ANSI alphanumeric character range, regardless of whether your locale supports the character set or not.
It is very important your formulas have the correct syntax. In most cases, if the syntax is not correct, a syntax error will be returned. In other cases, the syntax may be correct, but the values returned might not be what you are expecting. Power Pivot (and SQL Server Data Tools) includes IntelliSense; a feature used to create syntactically correct formulas by helping you select the correct elements.
Let’s create a simple formula. This task will help you further understand formula syntax and how the IntelliSense feature in the formula bar can help you.
Task: Create a simple formula for a calculated column
-
If you are not already in the Power Pivot window, in Excel, on the Power Pivot ribbon, click Power Pivot Window.
-
In the Power Pivot window, click the FactSales table (tab).
-
Scroll to the right-most column, and then in the column header, click Add Column.
-
Click in the formula bar along the top of the model designer window.
Your cursor now appears in the formula bar. The formula bar is where you can type a formula for a calculated column or a calculated field.
Let’s take a moment to look at the three buttons to the left of the formula bar.

When the cursor is active in the formula bar, those three buttons become active. The leftmost button, the X, is simply a cancel button. Go ahead and click it. Your cursor no longer appears in the formula bar, and the cancel button and checkmark button no longer appear. Go ahead and click in the formula bar again. The cancel button and the checkmark button now reappear. This means you are ready to start entering a formula.
The checkmark button is the check formula button. It doesn’t do much until you’ve entered a formula. We’ll come back to it in a little bit.
Click the Fx button. You’ll see that a new dialog box appears; the Insert Function dialog box. The Insert Function dialog box is the easiest way to get started entering a DAX formula. We’ll add a function to a formula when we create a measure a little later, but for now, you do not need to add a function to your calculated column formula. Go ahead and close the Insert Function dialog box.
-
In the formula bar, type an equals sign =, then type an opening bracket [. You’ll see a small window appears with all of the columns in the FactSales table. This is IntelliSense in action.
Because calculated columns are always created in the active table you are in, there is no need to precede the column name with the table name. Go ahead and scroll down and then double-click [SalesQuantity]. You can also scroll to the column name you want, and then press Tab.
Your cursor is now active to the right of [SalesQuantity].
-
Type a space, and then type a subtraction operator - (a minus sign), and then type another space.
-
Now, type another opening bracket [. This time, select the [ReturnQuantity] column, and then press Enter.
If you get an error, look carefully at your syntax. If necessary, compare it to the formula in the Margin calculated column described earlier.
After you press Enter to complete the formula, the word Calculating appears in the status bar along the bottom of the Power Pivot window. It goes quickly, even though you just calculated new values for more than three million rows.
-
Right click the column header and rename the column, NetSales.
That’s it! You just created a simple yet very powerful DAX formula. For each row in the FactSales table, the NetSales formula calculates a value by subtracting the value in the [ReturnQuantity] column from the value in the [SalesQuantity] column. Notice how we just said “For each row”. This is a glimpse of another very important concept in DAX; row context. You will learn more about row context later.
Something really important to understand when typing an operator into a DAX formula is the data type in the arguments you are using. For example, if you were to type the following formula, = 1 & 2, the value returned would be a text value of “12”. This is because the ampersand (&) operator is for text concatenation. DAX interprets this formula to read: Calculate a result by taking the value 1 as text and add value 2 as text. Now, if you were to type = 1 + 2, DAX reads this formula as: Calculate a result by taking the numeric value 1 and adding the numeric value 2. The result is of course “3”, a numeric value. DAX calculates resultant values depending on the operator in the formula, not based on the data type of columns used in the argument. Data types in DAX are very important, but outside the scope of this Quick Start. To learn more about data types and operators in DAX formulas, see the DAX Reference (http://go.microsoft.com/fwlink/?LinkId=239769&clcid=0x409) in Books Online.
Let’s try another. This time, you will create a measure by typing the formula and by using IntelliSense. Don’t worry too much if you don’t fully understand the formula. The important thing here is to learn how to create a formula using several elements together in correct syntax.
Task: Create a measure formula
-
In the FactSales table, click in any empty cell in the Calculation Area. This is the area of empty cells just below a table in the Power Pivot window.
-
In the formula bar, type the name Previous Quarter Sales:.
-
Type an equals sign = to begin the calculation formula.
-
Type the first few letters CAL, and then double-click the function you want to use. In this formula, you want to use the CALCULATE function.
-
Type an opening parenthesis ( to begin the arguments to be passed to the CALCULATE function.
Notice after typing the opening parenthesis, IntelliSense shows you the arguments required for the CALCULATE function. You will learn about arguments in a little bit.
-
Type the first few letters of the FactSales table, and then in the dropdown list, double-click FactSales[Sales].
-
Type a comma (,) to specify the first filter, then type, PRE, and then double-click the PREVIOUSQUARTER function.
After selecting the PREVIOUSQUARTER function, another opening parenthesis appears, indicating another argument is required; this time, for the PREVIOUSQUARTER function.
-
Type the first few letters Dim, and then double-click DimDate[DateKey].
-
Close both the argument being passed to the PREVIOUSQUARTER function and the CALCULATE function by typing two closing parentheses )).
Your formula should now look like this:
Previous Quarter Sales:=CALCULATE(FactSales[Sales], PREVIOUSQUARTER(DimDate[DateKey]))
-
Click the check formula button on the formula bar to validate the formula. If you get an error, verify each element of the syntax.
You did it! You just created a measure using DAX, and not an easy one at that. What this formula will do is calculate the total sales for the previous quarter, depending on the filters applied in a PivotTable or PivotChart.
You were just introduced to several important aspects of DAX formulas. First, this formula included two functions. Notice the PREVIOUSQUARTER function is nested as an argument passed to the CALCULATE function. DAX formulas can contain up to 64 nested functions. It is unlikely a formula would ever contain so many nested functions. In fact, such a formula would be very difficult to create and debug, and it probably wouldn’t be very fast either.
In this formula, you also used filters. Filters narrow down what will be calculated. In this case, you selected one filter as an argument, which is actually another function. You will learn more about filters later.
Finally, you used the CALCULATE function. This is one of the most powerful functions in DAX. As you author data models and create more complex formulas, you will likely use this function many times. Discussing the CALCULATE function is outside the scope of this QuickStart, but as your knowledge of DAX grows, pay special attention to this one.
Note: Typically, in order to use Time Intelligence functions in DAX formulas, you must specify a unique date column by using the Mark as Date Table dialog box. In the Contoso DAX Formula Samples.xlsx workbook, the DateKey column in the DimDate table is selected as the unique date column.
Extra Credit
You may be asking: ‘What is the simplest DAX formula I can create?’ Well, the answer to that is ‘the formula you don’t have to’. And, that is exactly what you can do by using a standard aggregation function in a measure. Almost any data model needs to filter and calculate on aggregated data. For example, the SUM function in the Sum of Sales Amount measure you saw earlier is used to add up all the numbers in a particular column. DAX includes several other functions that aggregate values as well. You can automatically create formulas using standard aggregations by using the AutoSum feature.
Extra Credit Task: Create a measure formula by using the AutoSum feature
-
In the FactSales table, scroll to the ReturnQuantity column, and then click on the column header to select the whole column.
-
On the Home tab, on the ribbon, in the Calculations group, click the AutoSum button.
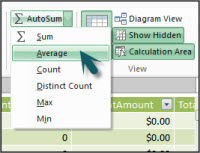
Click the down arrow next to AutoSum, and then click Average (notice the other standard aggregation functions you can use, too).
Immediately, a new measure is created with the name Average of ReturnQuantity: followed by the formula =AVERAGE([ReturnQuantity]).
Now wasn’t that easy? Of course, not all formulas you create will be so simple. But, by using the AutoSum feature, you can create quick and easy formulas by using standard aggregation calculations.
This should give you a fairly good understanding of syntax used in DAX formulas. You were also introduced to some really cool features like IntelliSense and AutoSum to help you create quick, easy, and accurate formulas. Of course there is a lot more you can learn about syntax. A good place to learn more is the DAX Reference or SQL Books Online.
Syntax QuickQuiz
-
What does this button on the formula bar do?

-
What always surrounds a column name in a DAX formula?
-
How would you write a formula for the following:
In the DimProduct table, for each row in the UnitMargin calculated column, calculate a value by subtracting values in the UnitCost column from values in the UnitPrice column?
Answers are provided at the end of this topic.
Functions
Functions are predefined formulas that perform calculations by using specific values, called arguments, in a particular order or structure. Arguments can be other functions, another formula, column references, numbers, text, logical values such as TRUE or FALSE, or constants.
DAX includes the following categories of functions: Date and Time, Information, Logical, Mathematical, Statistical, Text, and Time Intelligence Functions. If you are familiar with functions in Excel formulas, many of the functions in DAX will appear similar to you; however, DAX functions are unique in the following ways:
-
A DAX function always references a complete column or a table. If you want to use only particular values from a table or column, you can add filters to the formula.
-
If you need to customize calculations on a row-by-row basis, DAX provides functions that let you use the current row value or a related value as a kind of argument, to perform calculations that vary by context. You will learn more about context later.
-
DAX includes many functions that return a table rather than a value. The table is not displayed, but is used to provide input to other functions. For example, you can retrieve a table and then count the distinct values in it, or calculate dynamic sums across filtered tables or columns.
-
DAX includes a variety of time intelligence functions. These functions let you define or select date ranges, and perform dynamic calculations based on them. For example, you can compare sums across parallel periods.
Sometimes it is difficult to know which functions you might need to use in a formula. Power Pivot, and the tabular model designer in SQL Server Data Tools, include the Insert Function feature, a dialog box that helps you select functions by category and provides short descriptions for each function.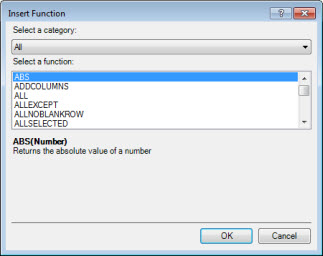
Let’s create a new formula which includes a function you will select by using the Insert Function feature:
Task: Add a function to a formula by using Insert Function
-
In the FactSales table, scroll to the right-most column, and then in the column header, click Add Column.
-
In the formula bar, type an equals sign, =.
-
Click the Insert Function button.

-
In the Insert Function dialog box, click the Select a category list box. By default, All is selected, and all of the functions in the All category are listed below. That’s a lot of functions, so you will want to filter the functions to make it easier to locate the type of function you are looking for.
-
For this formula, you want to return some data that already exists in another table. For that, you are going to use a function in the Filter category. Go ahead and click the Filter category, and then in Select a function, scroll down and double-click the RELATED function. Click Ok to close the Insert Function dialog box.
-
Use IntelliSense to help you find and select the DimChannel[ChannelName] column.
-
Close the formula and then press Enter.
-
After you press Enter to complete the formula, the word Calculating appears in the status bar along the bottom of the Power Pivot window. Now you will see that you just created a new column in the FactSales table with channel information from the DimChannel table.
-
Rename the column Channel.
Your formula should look like this: =RELATED(DimChannel[ChannelName])
You were just introduced to another very important function in DAX, the RELATED function. The RELATED function returns values from another table. You can use RELATED provided there is a relationship between the table you are currently in and the table that contains the values you want to get. Of course, the RELATED function has immense possibilities. In this case, you can now include the sales channel for each sale in the FactSales table. You can now hide the DimChannel table from the PivotTable field list, making it easier to navigate and see only the most important information you really need. Much like the CALCULATE function described earlier, the RELATED function is very important, and you will likely use it many times.
As you can see, functions in DAX can help you create very powerful formulas. We really only touched on the basics of functions. As your DAX skills improve, you will create formulas using many different functions. One of the best places to learn details about all of the DAX functions is in the Data Analysis Expressions (DAX) Reference.
Functions QuickQuiz
-
What does a function always reference?
-
Can a formula contain more than one function?
-
What category of functions would you use to concatenate two text strings into one string?
Answers are provided at the end of this topic.
Context
Context is one of the most important DAX concepts to understand. There are two types of context in DAX; row context and filter context. We will first look at row context.
Row Context
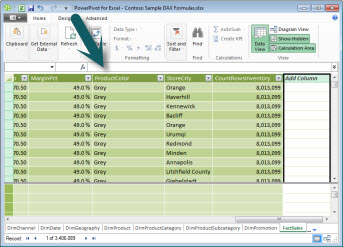
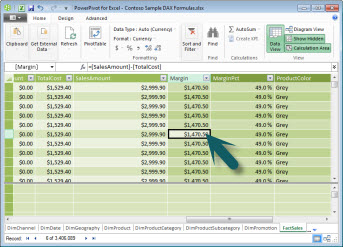
Row context is most easily thought of as the current row. For example, remember the Margin calculated column you saw earlier when learning about syntax? The formula =[SalesAmount] - [TotalCost] calculates a value in the Margin column for each row in the table. Values for each row are calculated from values in two other columns, [SalesAmount] and [TotalCost] in the same row. DAX can calculate the values for each row in the Margin column because it has the context: For each row, it takes values in the [TotalCost] column and subtracts them from values in the [SalesAmount] column.
In the selected cell shown below, the value, $49.54 in the current row was calculated by subtracting the value $51.54 in the [TotalCost] column from the value $101.08 in the [SalesAmount] column.
Row context doesn’t just apply to calculated columns. Row context also applies whenever a formula has a function that applies filters to identify a single row in a table. The function will inherently apply a row context for each row of the table over which it is filtering. This type of row context most often applies to measures.
Filter Context
Filter context is a little more difficult to understand than row context. You can most easily think of filter context as: One or more filters applied in a calculation that determines a result or value.
Filter context does not exist in place of row context; rather, it applies in addition to row context. For example, to further narrow down the values to include in a calculation, you can apply a filter context which not only specifies the row context, but also specifies only a particular value (filter) in that row context.
Filter context is easily seen in PivotTables. For example, when you add TotalCost to the Values area, and then add Year and Region to the Row or Columns, you are defining a filter context that selects a subset of data based on a given year and region.
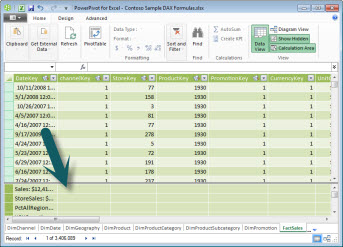
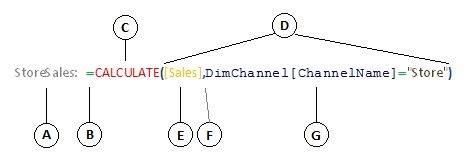
Why is filter context so important to DAX? Because, while filter context can most easily be applied by adding column and row labels and slicers in a PivotTable, filter context can also be applied in a DAX formula by defining a filter using functions such as ALL, RELATED, FILTER, CALCULATE, by relationships, and by other measures and columns. For example, let’s look at the following formula in a measure named StoreSales:
Clearly this formula is more complex than some of the other formulas you’ve seen. However, to better understand this formula, we can break it down, much like we’ve done with other formulas.
This formula includes the following syntax elements:
-
The measure name StoreSales, followed by a colon :.
-
The equals sign operator (=) indicates the beginning of the formula.
-
The CALCULATE function evaluates an expression, as an argument, in a context that is modified by the specified filters.
-
Parenthesis () surround one or more arguments.
-
A measure [Sales] in the same table as an expression. The Sales measure has the formula: =SUM(FactSales[SalesAmount]).
-
A comma (,) separates each filter.
-
The referenced column and a particular value, DimChannel[ChannelName] =”Store”, as a filter.
This formula will ensure only sales values, defined by the Sales measure, as a filter, are calculated only for rows in the DimChannel[ChannelName] column with the value “Store”, as a filter.
As you can imagine, being able to define filter context within a formula has immense and powerful capability. Being able to reference only a particular value in a related table is just one such example. Don’t worry if you do not completely understand context right away. As you create your own formulas, you will better understand context and why it is so important in DAX.
Context QuickQuiz
-
What are the two types of context?
-
What is filter context?
-
What is row context?
Answers are provided at the end of this topic.
Summary
Now that you have a basic understanding of the most important concepts in DAX, you can begin creating DAX formulas for calculated columns and measures on your own. DAX can indeed be a little tricky to learn, but there are many resources available to you. After reading through this topic a few times, and experimenting with a few of your own formulas, you can learn more about other DAX concepts and formulas that can help you solve your own business problems. There are many DAX resources available to you in Power Pivot Help, SQL Server Books Online, whitepapers, and blogs from both Microsoft and leading BI professionals. The DAX Resource Center Wiki (http://social.technet.microsoft.com/wiki/contents/articles/dax-resource-center.aspx) is a great place to start. The Data Analysis Expressions (DAX) Reference is also a great resource. Be sure to save it in your Favorites.
The DAX in the BI Tabular Model whitepaper, available for download (http://go.microsoft.com/fwlink/?LinkID=237472&clcid=0x409) provides a more detailed look at the concepts introduced here as well as many other advanced concepts and formulas. This whitepaper also uses the same Contoso DAX Sample Formulas.xlsx workbook you already have.
QuickQuiz Answers
Syntax:
-
Opens the Insert Function feature.
-
Brackets [].
-
=[UnitPrice] - [UnitCost]
Functions:
-
A table and a column.
-
Yes. A formula can contain up to 64 nested functions.
Context:
-
Row context and filter context.
-
One or more filters in a calculation that determines a single value.
-
The current row.


