
Manage business finances
It's key to keep track of the finances for your business. In Microsoft Excel, you can use one of the many templates to get started or build a workbook to track it all yourself.
What will I learn?
-
How to find a template in Excel
-
How to track revenue and expenditures
-
How to forecast your finances
What do I need?
-
15 minutes
-
Excel (desktop or web)
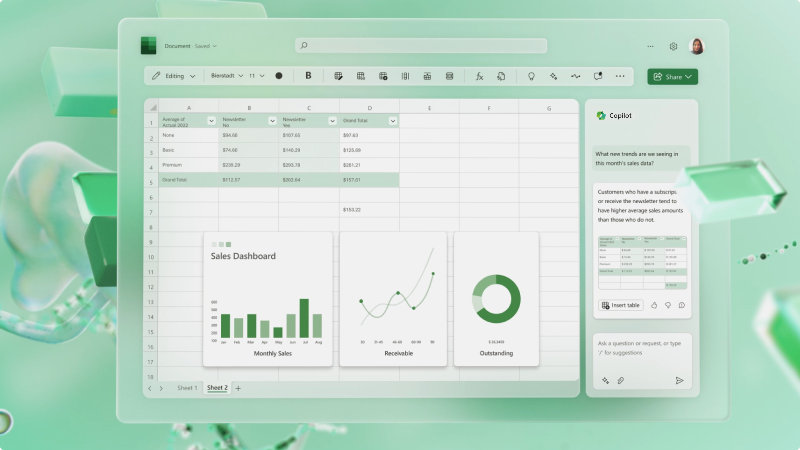
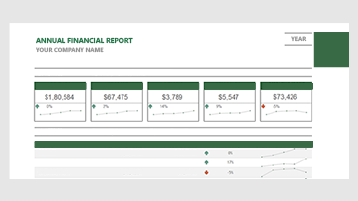
The first thing you'll want to do is explore the many template options for financial plans, reports, budgets, and more.
IYou can use one of these templates to build the kind of workbook you need for your business. In fact, it's likely you'll need a more than one to track everything or combine all into multiple worksheets.

-
Open Excel.
-
Type in the kind of template you're searching for, like "business budget" or "sales tracker."
-
Select any of the results to preview what the template looks like.
-
Select Create and the template will open.
-
Replace any data that is in the template with real data from your business, like item names, costs, and total sold.
-
Save the template and share it with others in your business.
Sometimes you just want to keep track of incoming revenue from sales and outgoing expenses. Here's how:
-
In Excel, open a new workbook.
-
Create a set of headings that you want to keep track of, like sales ID, sales total, and more. You can choose to keep your revenue and expenditures separate, or you could keep them together. Kind of like a bank account ledger showing deposits and transactions.
-
After you've added a few rows of data, you'll want to turn your data into a table. Select a cell within your range of data and then select Format as Table.
-
Choose a Table Style that you like.
-
In the ribbon, Table Design will pop up. Select it.
-
Choose Total Row in the Table Style Options section and a row that automatically sums up things like expenditures or sales data.
Need a little help? Go to Format an Excel table to learn more.
Excel can automatically create a forecast of your business revenue and expenses based on a simple history of each.
-
Add a list of revenue in Excel. Create a "Date" heading in one column and the "Revenue" in the other. You can make the information as granular as you want, from daily to weekly to even yearly.
-
Select Data > Forecast Sheet.
-
Choose the Forecast End. You can also go to Options and set more detailed info.
-
A new worksheet will be created with Lower and Upper Confidence forecasts of your revenue. This will include a chart as well.
Need a little help? Learn how to create a forecast in Excel for Windows.
Related topics
Need more help?
Want more options?
Explore subscription benefits, browse training courses, learn how to secure your device, and more.


Communities help you ask and answer questions, give feedback, and hear from experts with rich knowledge.


