Note: This article has done its job, and will be retiring soon. To prevent "Page not found" woes, we're removing links we know about. If you've created links to this page, please remove them, and together we'll keep the web connected.
Excel Services is a Microsoft Office SharePoint technology that makes it simple to use, share, secure, and manage Microsoft Office Excel 2007 workbooks (.xslx, xslb) as interactive reports in a consistent way throughout the enterprise.

In this article
What is Excel Services?
There are three basic components to Excel Services that interact with each other and together form the overall structural design of Excel Services.

1. Excel Calculation Services (ECS) is the "engine" of Excel Services that loads the workbook, calculates in full fidelity with Microsoft Office Excel 2007, refreshes external data, and maintains sessions.
2. Excel Web Access (EWA) is a Web Part that displays and enables interaction with the Microsoft Office Excel workbook in a browser by using Dynamic Hierarchical Tag Markup Language (DHTML) and JavaScript without the need for downloading ActiveX controls on your client computer, and can be connected to other Web Parts on dashboards and other Web Part Pages.
3. Excel Web Services (EWS) is a Web service hosted in Microsoft Office SharePoint Services that provides several methods that a developer can use as an application programming interface (API) to build custom applications based on the Excel workbook.
Because Excel Services is a component of Microsoft Office SharePoint Server 2007, you can also take advantage of many SharePoint technology features such as, controlling, securing, and managing access to spreadsheets, server-based performance, and ability to scale well when users are added.
What is Microsoft Office Excel Web Access?
Excel Web Access is a Web Part that displays data and charts from an Excel Workbook, has a similar "look and feel" to Microsoft Office Excel, such as sheet tabs, outline buttons, and drop-down arrows, and provides a number of ways to customize the Web Part.

1. The top section contains the title, and a toolbar which has several menus, commands, and a drop-down list.
2. The main window displays one or more worksheets in Worksheet view, a named item, such as a chart or an Excel table in Named Item view, and optionally an outline area.
3. The Parameters Task Pane has parameter labels, text boxes for data entry, and optional tool tips that provide more information about each parameter.
4. The bottom section displays refresh data messages.
How do Excel Services and Office Excel 2007 work together?
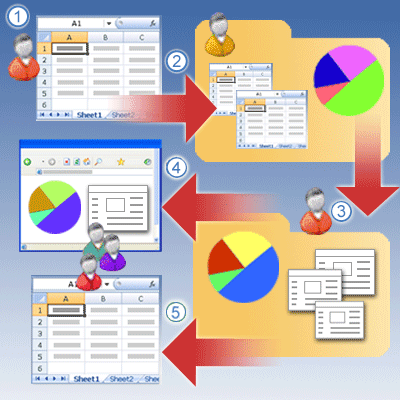
You must first create an Excel workbook by using Office Excel 2007, and then save the workbook in Excel Services. In essence, Office Excel 2007 is the authoring tool and Excel Services is the reporting tool.

1. A workbook author, often a business analyst, uses Office Excel 2007 to create the Excel workbook, optionally specify named items for viewing, and optionally define parameters.
2. The workbook author saves the workbook to a document library (or to a network or Web folder) in Excel Services, where it is managed and secured by a SharePoint administrator.
3. The workbook author and other users can create reports, Web Part Pages, and Business Intelligence dashboards that use the workbook.
4. Many business users can access the workbook by viewing it in a browser, and even refresh the data if the workbook is connected to an external data source.
5. With appropriate permission, business users can copy the current state of the workbook and any interactions made during the current session, such as sorting and filtering, to a client computer for further analysis either as an Excel workbook or a snapshot.
Interacting with an Excel workbook in Excel Services
Although you cannot edit the cells in the Excel workbook in Excel Services, you can interact with the data in a number of ways. To answer specific, unanticipated questions you might have about the data, you can often find and display information by using the following interactive features:
-
View the latest formula results by recalculating data in the workbook.
-
Refresh live data from an external data source, such as a database or an Online Analytical Processing (OLAP) cube.
-
Navigate to different worksheets, parts of worksheets, or selected named items in the workbook, such as a chart or an Excel table.
-
Sort and filter data.
-
Expand or collapse levels of data and use a report filter in a PivotTable report.
-
Temporarily change the values of cells by entering parameters to update the results of a formula or do simple what-if analysis.
-
Obtain different results or views by selecting data from another connected Web Part, such as a Filter Web Part or List View Web Part, on a dashboard or other Web Part Page.
Note: You can also copy the Excel workbook, open it in Excel 2007 on your computer, and then use all the features of Excel, including what-if analysis and well-formatted printing.
Excel Services scenarios
Of course, there are countless ways that you can use Excel Services, but the following is a representative list of scenarios and examples to help you better understand how you might use Excel Services.
Business intelligence dashboards An executive committee has access to several company dashboards that act as an up-to-date financial scoreboard for the company. To continuously assess company performance, the main dashboard summarizes Key Performance Indicators (KPIs), such as sales goals, target revenues, and profit margins, on a monthly basis. Additional dashboards summarize market news to help analyze financial risk for current and new projects, and to display charts of critical financial data to help evaluate different investment portfolios.
Marketing analysis information system A marketing department in a company that sells athletic clothing and equipment maintains an information portal page that summarizes key demographic data, such as gender, age, region, income-level, and preferred leisure activity. Most employees in the marketing department can optionally open the Excel workbooks on their computer and do "what-if" analysis of all data, or print well-formatted reports. Over time, users can also easily add reports for others to share.
Professional sports players statistics A major league sports organization shares past and present statistics on all players' performance and salaries. This data is used to make trades and to negotiate salary contracts. New reports and analyses are created, revised, and shared by owners, especially during the pre-season.
Retail store decision-making tool A retail chain summarizes critical point-of-sales data on a weekly basis and shares it with suppliers, financial analysts, and regional managers. Reports include current items below inventory, top 20 selling items by sales categories, important seasonal data, and transaction counts by each store.
Sales account management report system A sales group accesses a set of daily briefing reports that capture key data such as the top sales people, progress towards monthly sales targets, successful sales programs, and low-performing channels of distribution. Additional reports summarize sales by key variables, such as region, product line, and month, sales calls per week, and the number of closed calls. When individual sales people display these reports, they can automatically see their sales numbers because the system identifies them based on their user name.
Engineering project daily summary An engineering group develops a Web Part Page that summarizes key project schedule data such as bug counts, status of specifications, progress diagrams, feature trends and priorities, and links to key resources and contacts. The data is drawn from several external data sources, such as project databases and lists of specifications.
Proprietary financial analysis calculation model A large financial institution has researched and developed a pricing model that is private intellectual property. The results of the formula need to be shared with some investment managers, but the formula that is used to calculate the pricing model must be secure and never be publicly revealed. This pricing model is extremely complex and takes a long time to calculate. Every night, the pricing model report is calculated and created on a fast server, saved to a trusted location, and displayed on a Web Part Page, but only to those who have appropriate permission.
Creating "one version of the truth"
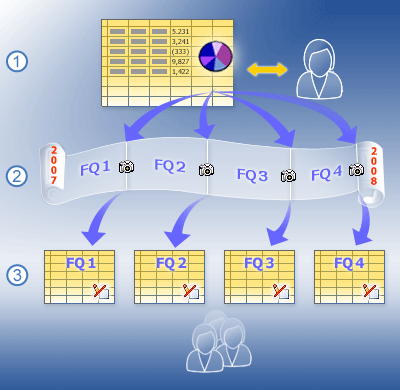
In most enterprises, you often need to create critical workbooks at a specific point in time, often on a regular schedule. For example, you might create a secure workbook at an agreed-upon date and time every fiscal quarter to confidently compare sales, inventories, revenues, and profits between fiscal quarters. You do not want to be concerned that the information in the workbook was changed by another user and that unexpected differences in calculations and results complicate your decision-making. This is sometimes called creating "one version of the truth", which means that when you compare the same workbook report with other users, you can rely on a unique point in time (the date and time that the workbook was created) to verify a consistent view of the data.

1. A master workbook contains cumulative financial data that is regularly updated.
2. A workbook is published at the end of each fiscal quarter.
3. "One version of the truth" simplifies decision-making and comparisons between fiscal quarters.
Connecting to data in a secure way
For some Excel workbooks saved to Excel Services, all the data is stored in the workbook. To update the data in Excel Services, the Excel workbook must be saved again. For other workbooks, there are one or more connections to external data sources, such as a database or OLAP cube. These connections contain information about how to locate, log in, query, and access the external data source. Although this connection information can be stored in the workbook, often it is stored in an Office Data Connection (.odc) file, especially when the data is shared by many users and the connection information needs to be updated. The workbook author or an administrator can create the connection information by using Excel 2007 to author the connection, and then to export the connection information to a .odc file.
A Data Connection Library (DCL) is a special SharePoint document library that can be defined as a trusted location library and that makes it easy to store, secure, share, and manage .odc files. For example an administrator may need a to move a database from a test server to a production server, or update a query that accesses the data. By using one .odc file saved in a DCL, administration of this connection information is much easier and the user's access to data is more convenient because all workbooks use the same connection file and a refresh operation, whether on the client or server computer, gets up-to-date changes to that connection file. You can even set up Office SharePoint Server and a user's client computer to automatically detect changes to the connection file and use the most up-to-date version of that connection file.
For more information, see the Microsoft Office Excel 2007 Help system and the Office SharePoint Server Central Administration Help system.
Excel Services and Information Rights Management
Information Rights Management (IRM) is a way to provide privacy protection for a Microsoft Office document and to ensure that sensitive information is only viewed by appropriate people. For example, you may want to report quarterly financial data only to select members of an executive committee one month before the data becomes publicly available in a financial statement, so they have time to prepare public relation responses and make appropriate business decisions.
Windows SharePoint Services Version 3.0 or later supports IRM on a document library and all the documents in that library (whether or not those individual documents are enabled with IRM). Once the document is uploaded to a document library enabled with IRM, the document, in effect, becomes IRM-enabled.
Excel Services does not support loading Excel workbooks that have been enabled with IRM, and it does not load an Excel workbook if it is enabled with IRM or comes from a document library enabled with IRM. However, if you want to take advantage of IRM, you can load an Excel workbook without IRM into Excel Services, open the workbook as a snapshot, and then save the snapshot to a document library that is enabled with IRM.
For more information, see the Microsoft Office Excel 2007 Help system and the Office SharePoint Server Central Administration Help system.
Using Excel Services with other Business Intelligence features
Excel Services is part of a collection of Office SharePoint Server features collectively called Business Intelligence that an individual, a team, or an entire enterprise can use. These features are designed to work together and support quick, robust development of customized decision-making tools that can access a variety of data sources — often without the use of code.
The Report Center
The Report Center provides a central location for various Business Intelligence data and objects, and contains special document libraries for storing reports, lists, Web Parts, Web Part Page templates, and .odc files. Within the Report Center, users can also search for items by using categories, view a calendar of upcoming reports, and subscribe to reports that they find relevant.
By default, an Excel workbook published and saved to a document library in the Report Center is single-click enabled to open the workbook in browser view, which is a convenient way to see the workbook without adding it to a Web Part Page.
The KPI List Web Part
The KPI List Web Part gets data from SharePoint lists, Excel workbooks, Microsoft SQL Server 2005 Analysis Services, or manual data entry, and then displays a Key Performance Indicator (KPI), which is a visual cue that communicates the amount of progress made toward a measurable goal. By using KPIs, you can easily visualize answers to the following questions:
-
What am I ahead or behind on?
-
How far ahead or behind am I?
-
What is the minimum I have completed?
Users can even drill down on the KPI items to see the detail behind the visualization. For instance, if the status of a KPI is red (indicating a problem), clicking on that KPI will automatically take the user to a report page that shows how the trend of the KPI over time, what the thresholds are, and the data that was used to determine the current status of the KPI.
Each area of a business may choose to track different types of KPIs, depending on the business goals that they are trying to achieve. For example, to increase customer satisfaction, a call center might set a goal to answer a specific number of calls within a shorter period of time. Or the sales department might use KPIs to set performance goals, such as the number of new sales calls made per month.
Filter Web Parts and the Apply Filter Button
You can use the Filter Web Parts to display only the subset of data that you are interested in viewing in other Web Parts and optionally the Apply Filter Button to perform the filter operation. For example, a data source can contain a five year history of multiple products for the entire country/region. By using the Filter Web Parts and Apply Filter Button, you can simultaneously display pertinent data for only one sales region, one product, or the current year in several Excel Web Access Web Parts.
Office SharePoint Services has a number of different Filter Web Parts that enable you to enter or to choose one or more values to change the contents of one or more Web Parts on a page to display exactly the information that you need.
For more information, see Connect Filter Web Parts to Excel Web Access.
Office Shared Services Dashboards
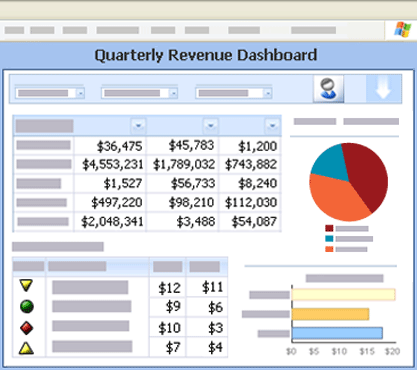
Microsoft Office SharePoint Server 2007 Dashboards are tools that are used to communicate status, observe trends, anticipate problems and opportunities, make decisions, and drive actions — often with graphics and charts. A Dashboard is a Web Part Page that displays information, such as reports, charts, metrics, and Key Performance Indicators (KPIs), from disparate data sources.
You can create your own dashboard by using a Dashboard template to quickly connect existing Web Parts, add or remove Web Parts, and customize the appearance of the page.
The following Web Parts can be included with the Dashboard template.
|
Web Part |
Use to |
|
Excel Web Access |
Display an Excel workbook, selected worksheets, or a named item, such as a named range or a chart. |
|
KPI List |
Display a KPI graphic and the data behind it. |
|
Filter (and Apply Filters button) |
Specify how to filter data and perform a filter operation. |
|
Related Information |
Link to related pages. |
|
Summary |
Describe information about plans and status. |
|
Contact Details |
List the name of the person to contact about the dashboard. |


