
Note: This article has done its job, and will be retiring soon. To prevent "Page not found" woes, we're removing links we know about. If you've created links to this page, please remove them, and together we'll keep the web connected.
With Get & Transform in Excel, you can search for data sources, make connections, and then shape that data (for example remove a column, change a data type, or merge tables) in ways that meet your needs. Once you’ve shaped your data, you can share your findings or use your query to create reports.
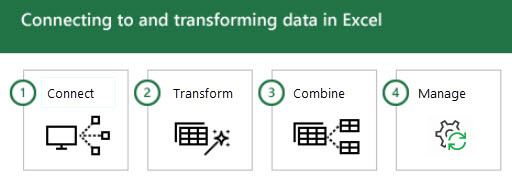
Looking at those steps in order, they often occur like this:
-
Connect – make connections to data sitting in the cloud, in a service, or locally
-
Transform – shape the data to meet your needs; the original source remains unchanged
-
Combine – create a data model from multiple data sources, and get a unique view into the data
-
Manage – once your query is complete you can save it, copy it, or use it for reports
Whenever you connect to data, transform it, or combine it with other data sources, a feature of Get & Transform called Query Editor records each step, and lets you modify it however you want. Query Editor also lets you undo, redo, change the order, or modify any step… all so you can shape your view of the connected data just the way you want it.
With Get & Transform, you can create queries that are as simple or complex as you need. As you add steps to a query, Query Editor works behind the scenes to create a set of discrete instructions that carry out your commands. Those instructions are created in the M Language. Users who enjoy the power and flexibility of data scripting can manually create or change M Language queries using the Advanced Editor. Query Editor and the Advanced Editor are described in more detail later in this article.
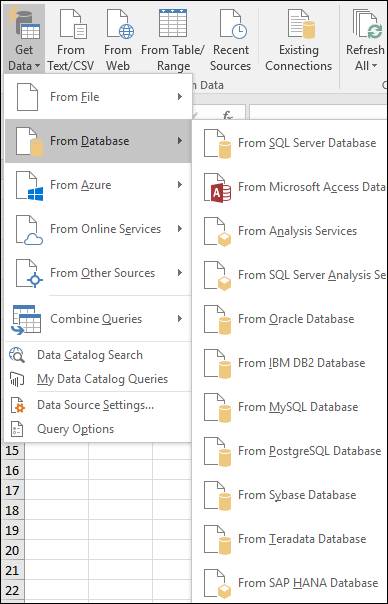
You can begin a new query from the Data tab > Get Data > Select a data source. If you don't see the Get Data button, then select the New Query button from the Data tab. Here's an example of choosing from a database source.
Note: Power Query is also available for previous versions of Excel as an add-in, as well as in Power BI. To see Power Query in action in previous versions of Excel, take a look at Getting Started with Power Query.
Connect
You can use a query to connect to a single data source, such as an Access database, or you can connect to multiple files, databases, OData feeds, or Web sites. You can then bring all those sources together using your own unique combinations, and uncover insights you might not otherwise have seen.
When you select Get Data from the Get & Transform section on the Data tab (or New Query if you don't see the Get Data button), you'll see many data sources to choose from, including files such as Excel workbooks or Text/CSV files, databases such as Access, SQL Server, Oracle, and MySQL, Azure services such as HDInsight or Blob Storage, and all sorts of other sources such as the Web, SharePoint Lists, Hadoop Files, Facebook, Salesforce, and others.
Note: You can learn about what data sources are available in which Excel versions here: Where is Get & Transform (Power Query).
When you connect to a data source, Get & Transform displays a Navigator pane, which allows you to edit the data from its source. When you select Edit from the Navigator window, Get & Transform launches the Query Editor, which is a dedicated window that facilitates and displays your data connections and the transformations you apply. The next section, Transform, provides more information about Query Editor.
Transform
Get & Transform lets you transform the data from your data sources in ways that help you analyze it. Transforming data means modifying it in some way to meet your needs – for example, you could remove a column, change a data type, or merge tables – each of which is a data transformation. As you transform data, it collectively takes on the shape you need to further your analysis. The process of applying transformations to one or more sets of data is often called shaping data.
Excel uses a dedicated Query Editor to facilitate and display data transformations. When you select Data > Get Data, then select the data source, such as a workbook, or a database, the Navigator window appears so you can select which table (or tables) you want to use in your query. When you select a table, a preview of its data is shown in the right pane of the Navigator window.
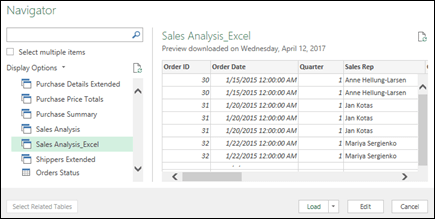
If you select Load, the data source is brought directly into Excel as is. If you select the Transform Data option, that will launch Query Editor.
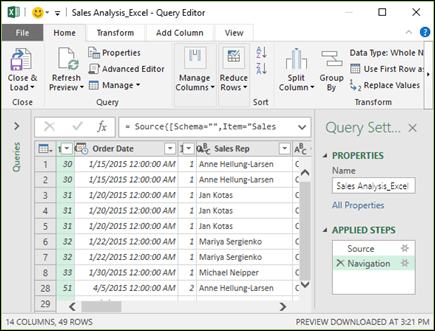
Query Editor keeps track of everything you do with the data. Query Editor records and labels each transformation, or step, you apply to the data. Whether the transformation is a connection to a data source, removing a column, a merge, or a data type change, Query Editor tracks each operation in the Applied Steps section of the Query Settings pane.
The transformations you apply to your data connections collectively constitute your query.
It’s important to know that the actions you define in Query Editor don't change the original source data. Instead, Excel records each step you take when connecting or transforming the data, and once you’ve finished shaping the data, it takes a snapshot of the refined data set and brings it into the workbook.
There are many transformations you can apply to data. You can also write your own transformations using the M Language with Query Editor’s Advanced Editor. You can open the Advanced Editor from Query Editor’s Home or View tabs, where you can modify the M Language steps associated with the existing query, or create your own.

When you’re done creating your query you can select Close & Load from the Home tab, and the query results are loaded into Excel and available in a new workbook tab.
Learn more about Transform:
Manage
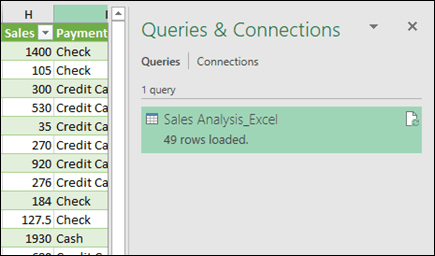
When you save an Excel workbook that contains a query, the query is automatically saved as well. You can view all queries in an Excel workbook by selecting Queries & Connections on the Data tab.
If you right-click over a query name in the Queries & Connections pane, you'll see several options. For instance, you can Duplicate a query, which lets you change some or all elements of a query without changing the original query; it’s like creating a query template that you can then modify to create customized datasets – like one dataset for retail, another for wholesale, and another for inventory, all of them based on the same data connections.
You can also Merge or Append queries, which lets you turn queries into reusable building blocks.

You can also publish your workbook to Power BI, and create online reports that can be shared with your group, refreshed automatically, and refined. To publish a workbook to Power BI, select File > Publish > Publish to Power BI.
Note: Your workbook must be saved to OneDrive for Business to publish it to Power BI.
Learn more about Managing your queries:
Need more help?
You can always ask an expert in the Excel Tech Community or get support in Communities.


