
You can organize tasks, establish timeframes, and illustrate dependencies at the start of a project with Program Evaluation and Review Technique (PERT) charts in Microsoft Visio.
You can also use PERT charts to illustrate the steps to a specific goal. For example, a PERT chart could outline the steps required for your department to meet its two-year revenue objectives.
Note: The Visio PERT chart is a manual drawing. If you prefer a more automated scheduling solution, and if you are using Visio 2016 or newer versions, please see Create a timeline in Visio.
What do you want to do?
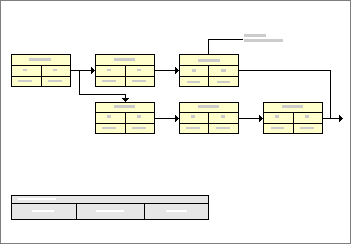
In a PERT chart, each rectangular shape, or node, represents a task. The connections between tasks indicate dependencies.
Create a PERT chart structure
Each project task or step is represented by a node. Nodes are divided into sections where you can record task data.
First, you'll drag a node for each task onto the drawing page. Then, you'll connect the nodes to indicate the order in which the tasks must be completed and the dependencies between them.
-
In Visio, on the File menu, point to New, point to Schedule, and then click PERT Chart.
-
From the PERT Chart Shapes stencil, drag a PERT 1 or PERT 2 shape onto the drawing page to create the first node.
-
Drag a second PERT 1 or PERT 2 shape onto the drawing page to create the second node.
-
Drag a Dynamic connector shape onto the drawing page.
-
Click away from the connector to see which end has an arrowhead, select the connector, and then drag the end without the arrowhead to the middle of the first node until a box appears around the entire shape.
Note: The box is green in Visio 2016 and newer versions.
-
Connect the other end of the connector to the second node the same way.
The shapes stay connected at the closest available points when you move them.
-
Continue dragging and connecting node shapes until each of your project tasks or steps is represented by a node.
Add information to a PERT chart
You can add task information to the nodes and to the connectors between the nodes.
Add task information to a node
-
Click a node to select it.
-
Type the name of a task to replace the node's default text.
-
Click one of the node's subdivisions to select it, and then type the text that you want to replace the default text.
Note: Use the default text in a node subdivision only as a guideline for the type of information you might add. For example, in the subdivision of the PERT 2 shape named Scheduled Finish, you can type the task's duration, or any other text pertinent to the task.
-
Repeat step 3 until you have replaced all the default text in each node.
Tip: To delete the default text and leave a node's subdivisions empty, select a subdivision, and then press the SPACEBAR.
Add text to a connector
-
Click a connector to select it.
-
On the connector, type the text you want to see.
Refine a PERT chart
|
Goal |
Take this action |
|---|---|
|
Change the task name in a node |
|
|
Revise text in a node subdivision |
|
|
Revise text on a connector |
|
|
Move a node |
Note: If you don't like the path the connector takes after you move a node, place the pointer over one of the connector's end points, and then drag it to a new connection point (blue x) on the node. Make sure that you see a red square around the new connection point. |
|
Delete a node |
Note: If you're not replacing the node with a new one, click the connector that pointed to the node, and then press DELETE again. |
Create a hierarchical summary of a project
You may want to brainstorm about the project's tasks and create a picture of how the tasks relate to one another before you start scheduling. You can use a specially designed shape on the PERT chart stencil to quickly create a hierarchical task summary.
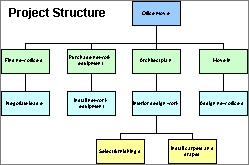
You can map out the relationships between the tasks in a project using the Summarization structure shape from the PERT Chart Shapes stencil.
Create a hierarchical task summary
-
On the File menu, point to New, point to Schedule, and then click PERT Chart.
-
Drag a Summarization structure shape from the PERT Chart Shapes stencil onto the drawing page.
-
Drag a second Summarization structure shape onto the drawing page and place it beneath the first shape.
-
Drag the control handle from the second shape, and glue it to a connection point on the bottom of the first shape.
-
Continue dragging Summarization structure shapes and gluing their control handles to shapes higher in the hierarchy until you've documented all the tasks in your project.


