
Important: In Excel for Microsoft 365 and Excel 2021, Power View is removed on October 12, 2021. As an alternative, you can use the interactive visual experience provided by Power BI Desktop, which you can download for free. You can also easily Import Excel workbooks into Power BI Desktop.
In Excel, you can connect to OLAP cubes (often called multidimensional cubes) and create interesting and compelling report pages with Power View.
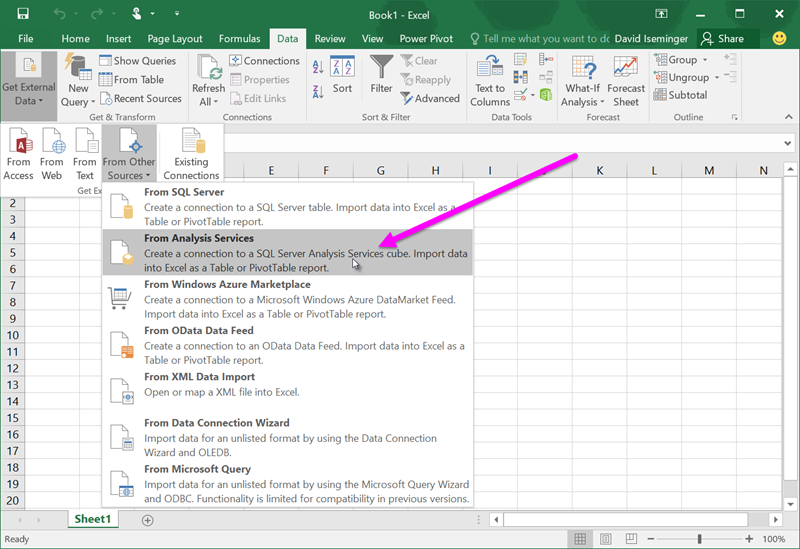
To connect to a multidimensional data source, from the ribbon select Data > Get External Data > From Other Sources > From Analysis Services.
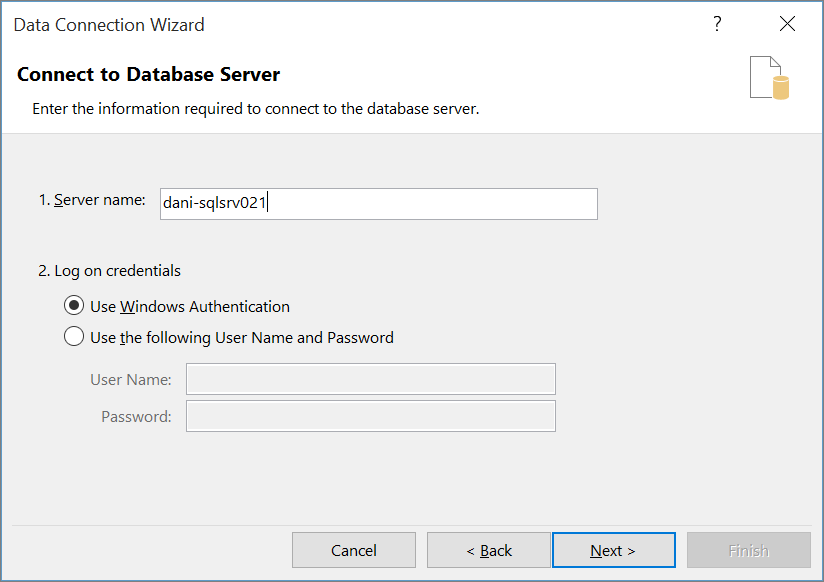
In the Data Connection Wizard, type the server name where the cube is hosted, then select and provide the appropriate credentials.
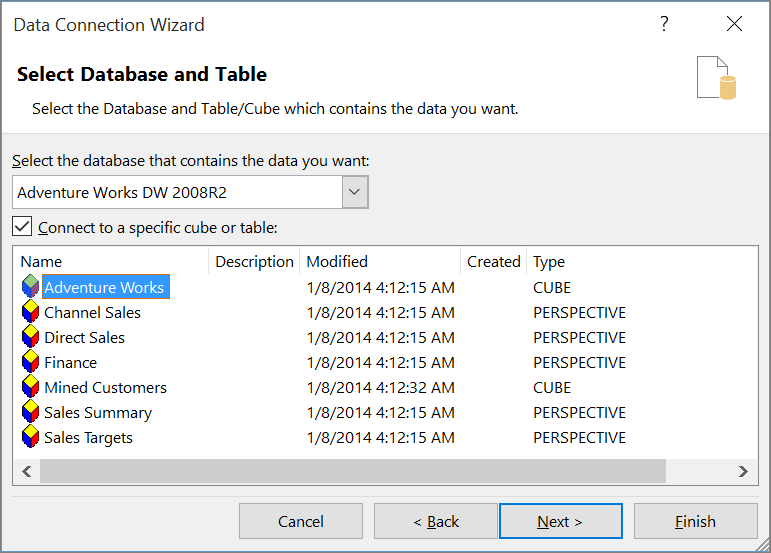
Excel presents a dialog that lists the databases, tables, and cubes that are available from the server.
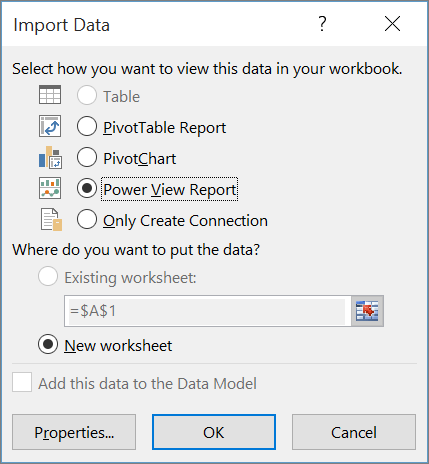
Once you select the cube you’re interested in using and select Next, you can choose where you want to view the connected data in your workbook. In this case you want to create a Power View report, so select the radio button next to Power View Report.
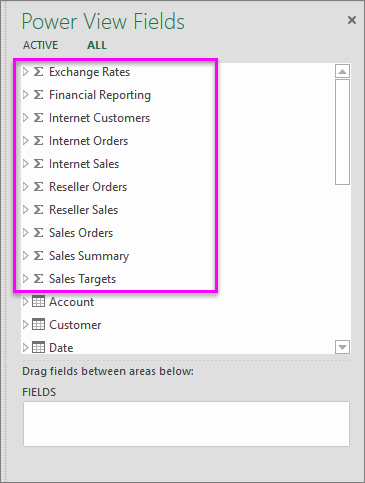
In the Power View Fields pane, you can see and access the available fields from the cube.

Now you’re ready to use the data from the cube to create compelling reports. You may find many different types of data, including the following:
-
Measure groups – this is the collection of measures found in the cube.
-
Measures and KPIs within a measure group – you can also use individual measures and KPIs from within measure groups. Just expand a measure group to see the available elements within a measure group, as shown in the following screen.
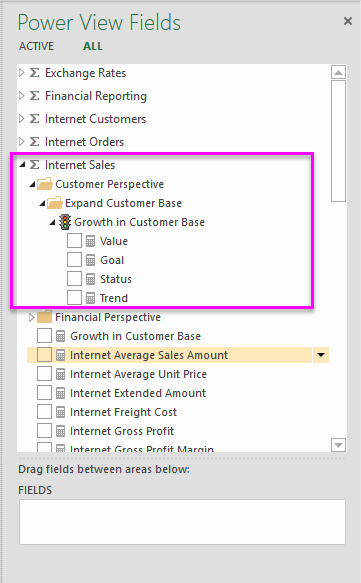
-
Dimensions, attributes and hierarchies – you can also use other fields from the cube, just like you would use in any other report.
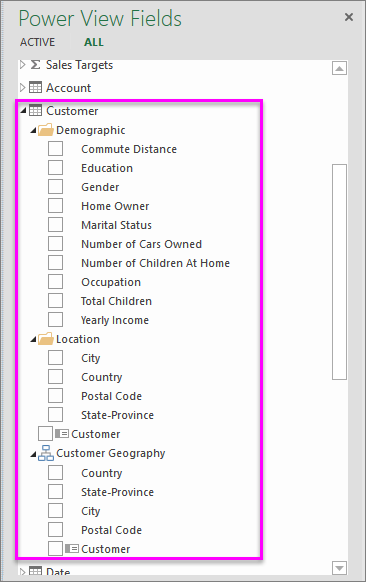
With all those available fields, you can create interesting, interactive reports with Power View and OLAP cubes.

Additional Resources
For more information about Power View, OLAP, or Analysis Services, take a look at the following links:


