
When you create a chart from worksheet data that uses dates, and the dates are plotted along the horizontal (category) axis in the chart, Excel automatically changes the category axis to a date (time-scale) axis. You can also manually change a category axis to a date axis.
A date axis displays dates in chronological order at specific intervals or base units, such as the number of days, months, or years, even if the dates on the worksheet are not in sequential order or in the same base units.
By default, Excel determines the base units for the date axis based on the smallest difference between any two dates in the worksheet data. For example, if you have data for stock prices where the smallest difference between dates is seven days, Excel sets the base unit to days, but you can change the base unit to months or years if you want to see the performance of the stock over a longer period of time.
Chart that uses a date axis
-
In the chart, right-click the category axis, and then click Format Axis.
-
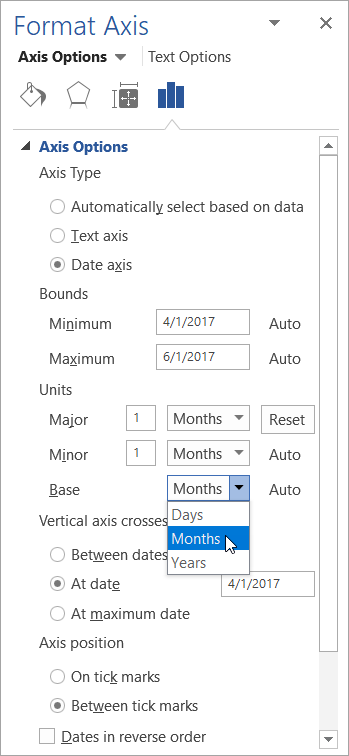
In the Format Axis pane, select the Axis Options tab.
-
Expand Axis Options, and then under Axis Type, make sure Date axis is selected.
-
Under Units, next to Base, select Days, Months, or Years.
Notes:
-
You cannot have a date axis if the dates in your chart appear in the legend. You may want to change the way that data is plotted in the chart so that the dates appear on the category axis instead.
-
Date axes are available on stock charts, line charts, column charts, bar charts, and area charts. Date axes are not available on PivotChart reports.
-
-
In the chart, right-click the category axis, and then click Format Axis.
-
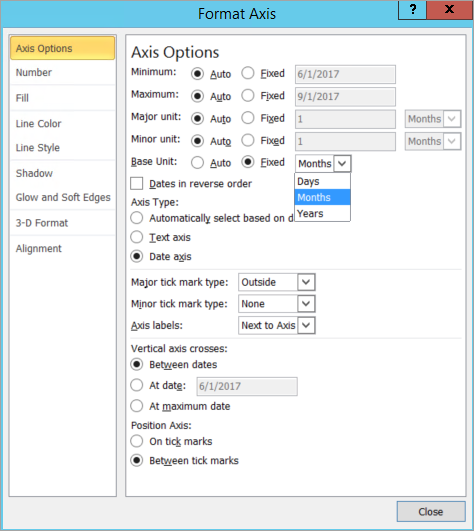
In the Format Axis dialog box, select Axis Options on the left.
-
Under Axis Type, make sure Date axis is selected.
-
Next to Base Unit, select Fixed, and then in the list, select Days, Months, or Years.
Notes:
-
You cannot have a date axis if the dates in your chart appear in the legend. You may want to change the way that data is plotted in the chart so that the dates appear on the category axis instead.
-
Date axes are available on stock charts, line charts, column charts, bar charts, and area charts. Date axes are not available on PivotChart reports.
-
-
In the chart, click the category axis, or do the following to select the axis from a list of chart elements.
-
Click a chart.
This displays the Chart Tools, adding the Design, Layout, and Format tabs. -
On the Format tab, in the Current Selection group, click the arrow next to the Chart Elements box, and then click the chart element that you want to use.
-
-
On the Format tab, in the Current Selection group, click Format Selection.
-
In the Axis Options category, under Axis Type, make sure Date axis is selected.
-
Under Axis Options, click Fixed for Base Unit and then, in the Base Unit box, click Days, Months, or Years.

Notes:
-
You cannot have a date axis if the dates in your chart appear in the legend. You may want to change the way that data is plotted in the chart so that the dates appear on the category axis instead.
-
Date axes are available on stock charts, line charts, column charts, bar charts, and area charts. Date axes are not available on PivotChart reports.


