
Instead of adjusting filters to show dates, you can use a PivotTable Timeline—a dynamic filter option that lets you easily filter by date/time, and zoom in on the period you want with a slider control. Click Analyze > Insert Timeline to add one to your worksheet.
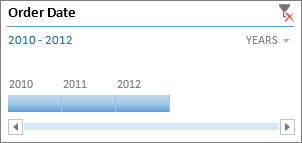
Much like a slicer for filtering data, you can insert a Timeline one time, and then keep it with your PivotTable to change the range of time whenever you like.
Here’s how:
-
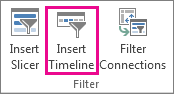
Click anywhere in a PivotTable to show the PivotTable Tools ribbon group, then click Analyze > Insert Timeline.
-
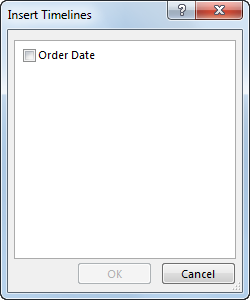
In the Insert Timeline dialog box, check the date fields you want, and click OK.
Use a Timeline to filter by time period
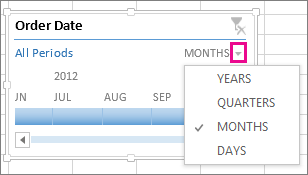
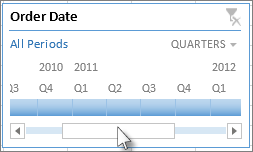
With your Timeline in place, you’re ready to filter by a time period in one of four time levels (years, quarters, months, or days).
-
Click the arrow next to the time level shown, and pick the one you want.
-
Drag the Timeline scroll bar to the time period you want to analyze.
-
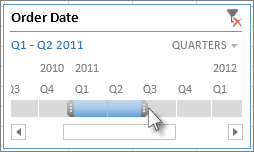
In the timespan control, click a period tile and drag to include additional tiles to select the date range you want. Use the timespan handles to adjust the date range on either side.
Use a Timeline with multiple PivotTables
Provided your PivotTables are using the same data source, you can use a single Timeline to filter multiple PivotTables. Select the Timeline, then on the ribbon, go to Options > Report Connections, and select the PivotTables you want to include.
Clear a timeline
To clear a timeline, click the Clear Filter button 
Tip: If you want to combine slicers with a timeline to filter the same date field, you can do that by checking the Allow multiple filters per field box in the PivotTable Options dialog box (PivotTable Tools > Analyze > Options > Totals & Filters tab).
Customize a timeline
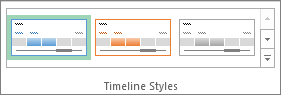
When a timeline covers your PivotTable data, you can move it to a better location and change its size. You can also change the timeline style, which may be useful if you have more than one timeline.
-
To move the timeline, simply drag it to the location you want.
-
To change the size of the timeline, click it, and then drag the sizing handles to the size you want.
-
To change the style of the timeline, click it to display the Timeline Tools, and then pick the style you want on the Options tab.
Need more help?
You can always ask an expert in the Excel Tech Community or get support in Communities.
See Also
Create a PivotTable to analyze worksheet data
Create a PivotTable to analyze external data
Create a PivotTable to analyze data in multiple tables


