
An organization chart (org chart) is a diagram of a reporting hierarchy that is commonly used to show relationships among employees, titles, and groups.
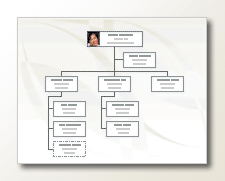
Org charts can range from simple diagrams (as in the adjoining illustration) to large and complex diagrams that are based on information from an external data source. The shapes in your org chart can display basic information such as name and title, or details such as department and cost center. You can even add pictures to the org chart shapes.
Create a simple organization chart
When you want to create a small org chart with default information fields, follow these steps:
-
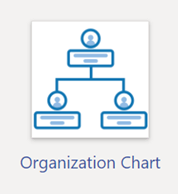
On the File tab, point to New, click Organization Chart, choose Metric Units or US Units and then select Create.
-
Select Cancel when you see the Organization Chart Wizard dialog box if you want to create only a simple org chart by yourself with default information fields.
-
The options on the Org Chart tab display various type of shapes, which you can use for members of your organization based on their positions.
Note: For information about how to add more data to the shapes, see Add data to shapes.
-
To automatically connect the shapes, drag the subordinate shapes onto superior shapes according to your organization hierarchy, or you can choose to manually connect using the connector shapes. Type a name and title for each one and also add a picture of members if you want.
-
You can arrange the Layout of org chart, space between shapes, the height and width of shapes, using the various commands and options on the Org Chart tab.
Automatically create an organization chart from a new data table
You can use this method if you want to change or add more information then default information fields, and you don't already have your data in a different program file.
-
On the File tab, point to New, select Organization Chart, choose Metric Units or US Units and then select Create.
-
On the first page of the Organization Chart Wizard, select Information that I enter using the wizard, and then select Next.
-
Select Excel or Delimited text, type a name for the new file, and then selct Next.
Note: If you select Excel, a Microsoft Office Excel worksheet opens with sample text. If you select Delimited text, a Microsoft Notepad page opens with sample text.
-
When either Excel or Notepad opens, use the sample text as an example of what kind of information to include, and type your information over what is there.
Important: Do not delete Name and Reports_to columns, but you may change, delete, or add other columns you may need for your org chart.
-
Exit either Excel or Notepad file after adding your information, and then select Next to continue.
-
To include pictures on your org chart, select Don’t include pictures in my organization chart, otherwise select Locate the folder that contains your organization pictures. Follow the remaining instructions on this page, and then select Next to continue.
-
On the last page of the wizard, you can specify how much of your organization to display on each page. You can choose I want to specify how much of my organization to display on each page, or you can let the wizard define each page automatically by selecting I want the wizard to automatically break my organization chart across the pages.
-
If you want to hyperlink and synchronize employee shape across the pages, select the options Hyperlink employee shape across the pages and Synchronize employee shape across the pages.
-
After you made all your selections, select Finish.
Note: Specific help is available for most wizard pages. To access Help, press F1 or select the Help button.
Automatically create an organization chart by using an existing data source
This method is best if the information that you want to include in your org chart is already in a document such as a Microsoft Office Excel worksheet, Microsoft Exchange Server directory, an ODBC-compliant data source, or an Org Plus text file.
-
Make sure your table or worksheet contains columns for employee names, unique IDs, and who reports to whom.
Note: You can name the columns whatever you want. When you run the Organization Chart Wizard, you can identify which columns (or field names) contain the name, ID, and report-to.
-
Employee name The way that employee names appear in this field is the way that they appear on the organization chart shapes.
-
Unique identifier If each name is not unique, include a column with a unique identifier, such as an employee ID number, for each employee.
-
Whom the employee reports to This field must contain each manager's unique identifier, whether that identifier is a name or an ID number. For the employee at the top of the organization chart, leave this field blank.
-
-
On the File tab, point to New, select Organization Chart, choose Metric Units or US Units and then select Create.
-
On the first page of the wizard, select Information that's already stored in a file or database and then select Next to continue.
-
Choose the file type where your organization information is stored in by selecting Browse, then browse to the location of this file. Select the language you want to use on the chart wizard and then select Next to continue.
-
On the next page of the wizard, select the column (fields) in your data file that contain the information that defines your organization such as Name, Reports To, and First Name. Select Next to continue.
-
On the next page of the wizard, you can define what specific fields you want displayed by using the Add and Remove buttons and the display order of the fields by using the Up and Down buttons. Select Next to continue.
-
On the next page of the wizard, you can choose the fields from your data file that you want to add to organization chart shapes as shape data fields. Select Next to continue.
-
To include pictures on your org chart, select Don’t include pictures in my organization chart, otherwise select Locate the folder that contains your organization pictures. Follow the remaining instructions on this page, and then select Next to continue.
-
On the last page of the wizard, you can specify how much of your organization to display on each page. You can choose I want to specify how much of my organization to display on each page, or you can let the wizard define each page automatically by selecting I want the wizard to automatically break my organization chart across the pages.
-
If you want to hyperlink and synchronize employee shape across the pages, select the options Hyperlink employee shape across the pages and Synchronize employee shape across the pages.
-
After you made all your selections, select Finish.
Note: Specific help is available for most wizard pages. To access Help, press F1 or select the Help button.
Show teams by using the Team Frame or dotted lines
After you create an org chart, you can rearrange the information to reflect virtual team relationships. Move related shapes near each other, and then add dotted-line connectors to show secondary reporting structures, or use the Team Frame shape to highlight a virtual team. The dotted-line report behaves like an ordinary connector. The Team Frame is basically a modified rectangle shape that you can use to visually group and name teams.

Update generated organization charts
To reflect changes in the structure of an organization, you must update the org chart manually or generate a new chart. If you generate a new chart, no customizations that were made to the earlier chart are included in the new chart. If themes or photos were added to shapes, they must be added again to make the charts look similar.
If the shapes are linked to data, the data is updated normally when you run Refresh Data, but only inside existing shapes. Refreshing the data does not add or remove shapes.
See Also
Video: Create an organizational chart
Create an organization chart automatically from employee data
Create an organization chart without external data
Create an org chart by using Visio for the web
Show or hide information in a Visio organization chart
Lay out the shapes in your organization chart
About breaking your organization chart across multiple pages
Find sample organizational chart Visio templates and diagrams
In Visio for the web, you can draw an org chart based on several stencils. That process is described below.
The other method is to create an org chart based on Excel data. That process is described in a separate article, Create an org chart based on Excel data by using Visio for the web.
Visio for the web has five stencils with shapes for making organization charts:
Basic stencil

Badge stencil
Medal stencil
Pinboard stencil

Rollout stencil

Draw an organization chart
To create an organization chart, add the stencil you want to use to your file.
-
Select File > New, then select Organization Chart:
-
In the Shapes pane, in the left margin, choose from among the five org-chart stencils, beginning with basic organization chart. (The images above illustrate the look of the shapes in each stencil.)
-
Begin dragging shapes onto the canvas.
-
Use connectors to show the organizational hierarchy.

For more details, see Add connectors between Visio shapes.
-
If you want to change the color of a shape, right-click it and select

Apply a layout to the organization chart you've drawn
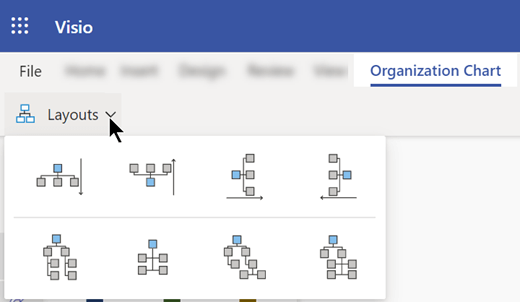
Once your shapes are drawn and connected, select the layout option you prefer. Visio provides eight layout options for the visual hierarchy of your organization chart:
-
On the Organization Chart tab on the toolbar, select Layouts.
-
Select from options for top to bottom, bottom to top, left to right, right to left, side-by-side, or hybrid combinations.
Create organization charts quickly
In Visio in Microsoft 365, Visio Plan 1, and Visio Plan 2, there are two methods for adding new nodes quickly. The first node must be dragged from the Shape pane (on the left of the window). Further nodes that you connect to first one can then be added in either of the following two ways:
Create new nodes using the ‘plus’ button
Point at a node on the canvas until the 
Drag-and-drop node "snapping"
Drag a node from the Shape pane (on the left side of the window) on top of another node on the canvas. The dropped node is automatically connected to the selected node as its child, in a lower level of hierarchy.
Customize your organization chart
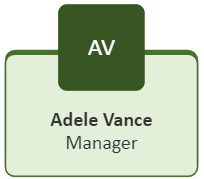
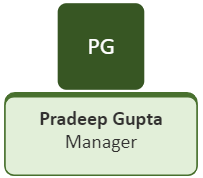
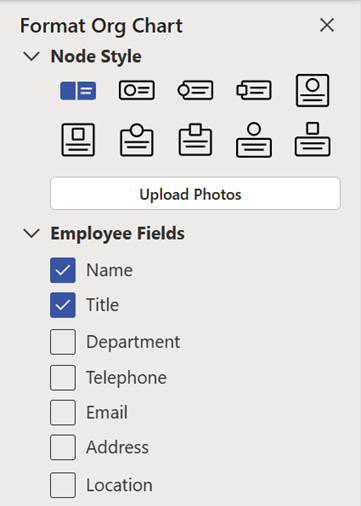
Visio Plan 1 and Visio Plan 2 users can further customize an org chart by using the Format Org Chart task pane that appears on the right side of the drawing canvas. The task pane opens to the right of the drawing canvas when you've started from any of the available org chart templates or when you have pinned any of the org chart stencils (e.g., Basic, Medal, Rollout, Badge, or Pinboard). You can change the style of a shape, add photos to the shapes, and add descriptive fields to the shapes.
By default, Name and Title are the visible employee fields, and the picture placeholder has initials entered in it when you first add shapes to the canvas.
Customizations can be applied to a select set of org chart shapes or all the org chart shapes on the canvas. If no shape is selected on the canvas, then changes you make are applied to all the shapes on the canvas. Following customizations are now available:
-
Change the node style:
In the Format Org Chart task pane, under Node Style, select the style you want for your shapes (basic square, basic circular, rollout circular, and so on).
-
Upload photos:
Select Upload Photos to upload one or more photos at once—for each person represented in the org chart. If you upload multiple pictures at once, the image files should have names that match those used in the org chart. The files should be JPG, JPEG, or PNG files with a maximum file size of 6 MB each.
-
Add employee fields:
Under Employee Fields, select or clear check boxes to indicate which fields you want to appear in each shape. Each shape can individually have certain employee fields made visible. Once added, in each shape double-click a field name to select it and start typing the value you want entered in that field. (For example, you could double-click a Department label and type Human Resources.)


