
A flow chart shows sequential steps in a task or process. There are many different SmartArt layouts that you can use to illustrate the steps in a process, including layouts that can contain pictures.
This article explains how to create a flow chart that contains pictures. You can use the methods described in this article to create or change almost any SmartArt graphic. Try different layouts to achieve the results you want.
What do you want to do?
Create a flow chart with pictures
-
On the Insert tab, in the Illustrations group, click SmartArt.
-
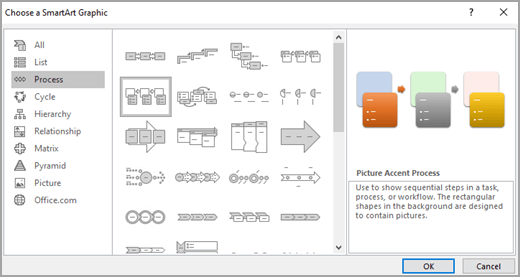
In the Choose a SmartArt Graphic gallery, click Process, and then double-click Picture Accent Process.
-
To add a picture, in the box you want to add it to, click the picture icon

-
To enter text, do one of the following:
-
Click [Text] in the Text pane, and then type your text.
Note: If the Text pane is not visible, on the Design tab, click Text Pane.
-
Copy text from another location or program, click [Text] in the Text pane, and then paste your text.
-
Click in a box in the SmartArt graphic, and then type your text.
Note: For best results, use this option after you add all of the boxes that you want.
-
Add or delete boxes in your flow chart
Add a box
-
Click the SmartArt graphic that you want to add a box to.
-
Click the existing box that is located closest to where you want to add the new box.
-
On the Design tab, in the Create Graphic group, click the arrow next to Add Shape.
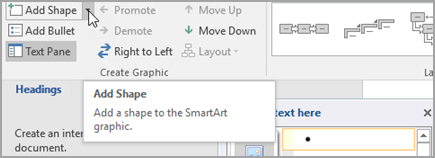
If you don't see the Design tab, make sure that you've selected the SmartArt graphic.
-
Do one of the following:
-
To insert a box at the same level as the selected box but following it, click Add Shape After.
-
To insert a box at the same level as the selected box but before it, click Add Shape Before.
-
When you need to add a box to your flow chart, experiment with adding the box before or after the selected box to get the placement you want for the new box.
Add a box from the Text pane
-
Place your cursor at the beginning of the text where you want to add a box.
-
Type the text that you want in your new box, press ENTER, and then to indent the new box, press TAB, or to negative indent, press SHIFT+TAB.
Delete a box
-
To delete a box, click the border of the box you want to delete, and then press DELETE.
Move a box in your flow chart
-
To move a box, click the box, and then drag it to its new location.
-
To move a box in very small increments, hold down CTRL while you press the arrow keys on your keyboard.
Change the colors of your flow chart
To quickly add a designer-quality look and polish to your SmartArt graphic, you can change the colors or apply a SmartArt Style to your flow chart. You can also add effects, such as glows, soft edges, or 3-D effects. And in PowerPoint presentations, you can animate your flow chart.
Apply theme colors
-
Click the SmartArt graphic whose color you want to change.
-
On the Design tab, in the SmartArt Styles group, click Change Colors.
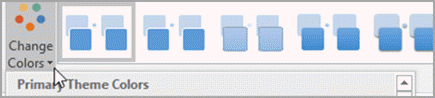
If you don't see the Design tab, make sure that you've selected a SmartArt graphic.
-
Click the color combination that you want.
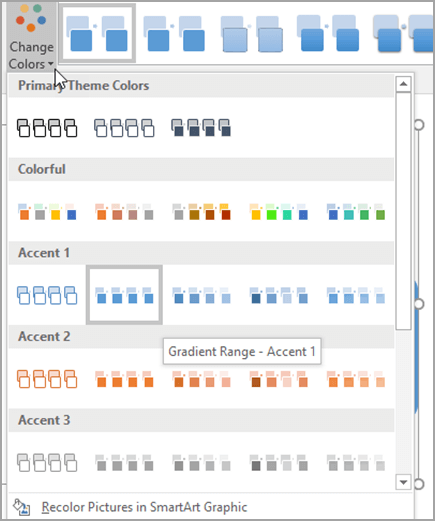
Tip: When you place your pointer over a thumbnail, you can see how the colors affect your SmartArt graphic.
Change the background style or color of a box in your flow chart
-
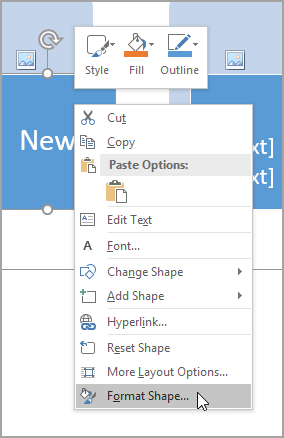
In the SmartArt graphic, right-click in the box you want to change, and then click Format Shape.
-
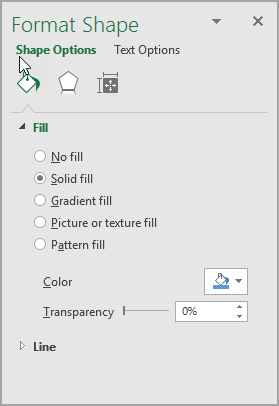
To change the fill style, in the Format Shape pane, click the arrow next to Fill to expand the list, and then choose from the following options:
-
No fill
-
Solid fill
-
Gradient fill
-
Picture or texture fill
-
Pattern fill
-
-
Click Color

-
To specify how much you can see through the background color, move the Transparency slider, or enter a number in the box next to the slider. You can vary the percentage of transparency from 0% (fully opaque, the default setting) to 100% (fully transparent).
Change the style or color of a box's border
-
In the SmartArt graphic, right-click in the box you want to change, and then click Format Shape.
-
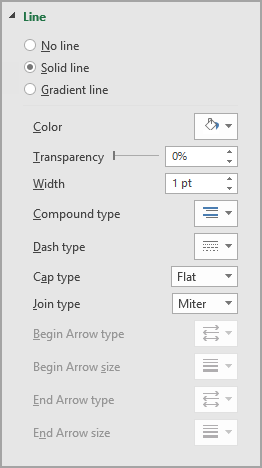
To change the color of the box's border, in the Format Shape pane, click the arrow next to Line to expand the list, and then choose from the following options:
-
No line, solid line, or gradient line
-
Color
-
Transparency (use the Transparency slide control or enter a percentage)
-
Width (in pixels)
-
Compound type
-
Dash type
-
Cap type
-
Apply a SmartArt Style to your flow chart
A SmartArt Style is a combination of various effects, such as line style, bevel, or 3-D, that you can apply to the boxes in your SmartArt graphic to create a unique and professionally designed look.
-
Click the SmartArt graphic whose SmartArt Style you want to change.
-
On the Design tab, in the SmartArt Styles group, click the style that you want.
To see more SmartArt Styles, click the More button
If you don't see the Design tab, make sure that you've selected a SmartArt graphic.
Notes:
-
When you place your pointer over a thumbnail, you can see how the SmartArt Style affects your SmartArt graphic.
-
You can also customize your SmartArt graphic by moving boxes, resizing boxes, adding a fill or effect, and adding a picture.
-

Animate your flow chart
If you're using PowerPoint, you can animate your flow chart to emphasize each box.
-
Click the SmartArt graphic that you want to animate.
-
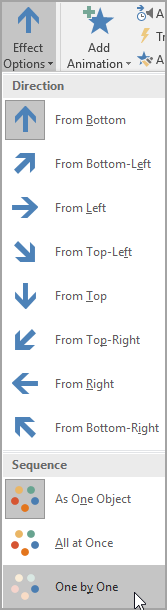
On the Animations tab, in the Animation group, click Effect Options, and then click One by one.
Note: If you copy a flow chart that has an animation applied to it to another slide, the animation is also copied.


