Business intelligence (BI) is essentially the collection of tools and processes that are used to gather data and turn it into meaningful information that people can use to make better decisions. Excel 2013 offers lots of new BI features and functionality, making it easier than ever to gather data and use the data to create powerful reports, scorecards, and dashboards. Excel Services in SharePoint Server 2013 (on premises) enables you to share, view, explore, and refresh workbooks in a browser window, similar to how it works in Excel.
Read this article to learn about BI features in Excel and which ones are supported in Excel Services and Excel Web App.
Note: The information in this article applies to Excel 2013 and SharePoint Server 2013 (on premises) only. If you’re looking for information about BI in the cloud, see BI capabilities in Power BI for Microsoft 365, Excel, and SharePoint Online.
In this article
What BI capabilities are available in Excel?
In Excel 2013, you can perform a wide range of tasks—from getting data to creating reports—as part of your organization’s BI solution. The following table summarizes the powerful BI capabilities that are available in Excel.
|
Task |
Description |
|---|---|
|
Get data into Excel |
You can Import data from external data sources, such as SQL Server tables, SQL Server Analysis Services cubes, Microsoft Azure data, OData data, and more. You can use Power Query to find, combine, and refine data across a wide variety of sources, including internal and external data sources. You can import data into Excel, or you can use a data connection to create charts, tables, and reports using external data. |
|
Sort, organize, and work with data in Excel |
You can use Flash Fill to format columns of data to display a particular way. You can also create a Data Model to combine one or more tables of data into a single data source that you can use to create reports, including views that you create by using Power View. You can use Quick Analysis to select data and see recommended ways to visualize that data. |
|
Visualize data in Excel |
You can create a wide variety of reports that include tables, line charts, bar charts, radar charts, and so on. You can use Power Map to create three-dimensional data visualizations on a globe. You can use Power View to create mashups that include interactive charts and tables. And, you can create reports that use conditional formatting and key performance indicators (KPIs) to show at a glance whether performance is on or off target for one or more metrics. |
|
Apply filters to charts and tables in Excel |
You can add slicers, timeline controls, and filters to worksheets to make it easier to focus on more specific information. |
|
Explore and analyze data in Excel |
You can use Quick Explore to explore information in a PivotChart report or a PivotTable report, and view additional information about that value in a new chart or table on the screen. You can also use lots of other BI features to analyze data in Excel. |
|
Use more advanced analytic capabilities |
If you are an advanced user, you can create Calculated Measures and Calculated Members for PivotChart reports or PivotTable reports that use Analysis Services data. And, you can create Calculated Fields in Power Pivot. |
For more information about new features in Excel, see What's new in Excel 2013.
What Excel BI features are supported in SharePoint Server 2013?
Many of the BI capabilities that are available in Excel are supported in Excel Services in SharePoint Server 2013 (on premises). This means that you can view and interact with workbooks in a browser window much like you would by using the Excel client. In general, the following features are supported:
-
Refreshing external data In most cases, workbooks that are published to SharePoint libraries retain live data connections so that people can typically refresh the data. For more information, see Work with external data in Excel Services (SharePoint Server).
-
Viewing workbooks that contain a Data Model (This requires Excel Services to be configured to support Data Model functionality.) See Data models in Excel Services.
-
Viewing, sorting, and exploring data in reports in a browser window You can interact with a workbook in a browser window similar to how you would do that in Excel See Video: Explore a workbook in the browser.
-
Displaying a single item in a workbook in its own SharePoint Web Part A single item can include a PivotChart report, a PivotTable report, a worksheet, or a range of data in Excel. See Display Excel content in an Excel Web Access Web Part.
-
Choosing between worksheet view and gallery view You can choose how you want workbooks to be displayed in a browser window. See Use Browser View Options to specify how you want a workbook to display in a browser window.
When you’re using a workbook in a browser window, you can’t create certain kinds of items, such as timeline controls, PivotChart reports, PivotTable reports, calculated members, and calculated measures. You can, however, create those items in Excel, upload the workbook to a library in SharePoint Server 2013, and then view that workbook in the browser.
What Excel BI features are supported in Excel Services (SharePoint Server) together with Excel Web App (Office Web Apps Server)?
If your organization is using SharePoint Server 2013 together with Office Web Apps Server (on premises), then the BI capabilities that are supported depend on how things are configured. Either Excel Services (SharePoint Server 2013) or Excel Web App (Office Web Apps Server) is used to render workbooks in a browser window.
Excel Services and Excel Web App are not exactly the same, so this decision affects which BI capabilities are available to you when you are using a workbook in a browser window. The following table summarizes some of the key differences:
|
Feature |
What’s supported when Excel Web App is used to render workbooks |
What’s supported when Excel Services is used to render workbooks |
|---|---|---|
|
Most kinds of secure external data connections are not supported. For more information, see Working with external data in Excel Services. |
Most kinds of external data connections are supported, as is the ability to refresh data in a browser window. For more information, see Working with external data in Excel Services. |
|
|
You can view workbooks that contain a Data Model, but in general, you cannot explore data in certain items, such as PivotChart reports, PivotTable reports, and timeline controls that use a Data Model as their data source. Data refresh is not supported in a browser window, but you can open the workbook in Excel to refresh its data. |
You can view and interact with items in workbooks that contain a Data Model. |
|
|
The ability to use Flash Fill when viewing or editing a workbook in a browser window is not supported. You must open the workbook in Excel to use this feature. |
The ability to use Flash Fill when viewing a workbook in a browser window is not supported. You must open the workbook in Excel to use this feature. |
|
|
The ability to use Quick Analysis when viewing or editing a workbook in a browser window is not supported. You must open the workbook in Excel to use this feature. |
The ability to use Quick Analysis when viewing a workbook in a browser window is not supported. You must open the workbook in Excel to use this feature. |
|
|
Charts and tables, PivotTables, PivotCharts, reports, and scorecards |
The ability to view, sort, filter, and interact with reports and scorecards that were created by using Excel is supported in a browser window. |
The ability to view, sort, filter, and interact with reports and scorecards is supported in a browser window. |
|
Currently, views that were created by using Power Map are not supported. You must open the workbook in Excel to use this feature. |
Currently, views that were created by using Power Map are not supported in a browser window. You must open the workbook in Excel to use this feature. |
|
|
Views that were created by using Power View are not supported in Excel Web App. |
Views that were created by using Power View are supported in Excel Services. |
|
|
The ability to use existing slicers and timeline controls is supported. |
The ability to use existing slicers and timeline controls is supported. |
|
|
The ability to use Quick Explore is supported in a browser window. |
The ability to use Quick Explore is supported in a browser window. |
|
|
Workbooks that contain calculated measures and calculated members are supported. |
Workbooks that contain calculated measures and calculated members are supported. |
|
|
Calculated fields are not supported in Excel Web App. |
The ability to use existing calculated fields is supported in Excel Services. |
Learn more about Microsoft BI tools
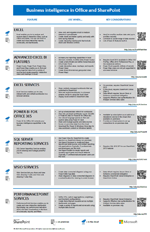
This article covers BI in Excel and Excel Services, but there are other Microsoft BI tools available. Get the poster
|
|
BI in Office and SharePoint to learn more about BI tools in Office and SharePoint. The poster summarizes all the BI tools that are available—on premises and in the cloud—with links to additional information about each tool. |