
Analyze data with Excel for Windows
Create a chart
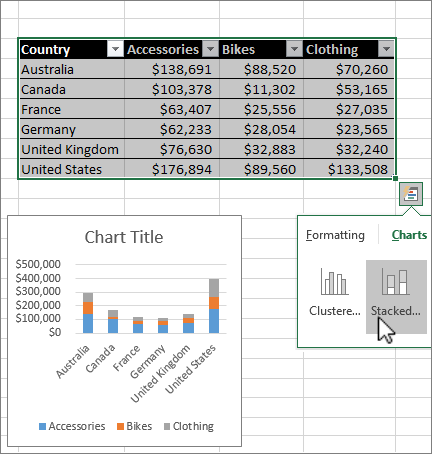
Use the Quick Analysis tool to pick the right chart for your data.
-
Select the data you want to show in a chart.
-
Select the Quick Analysis button

-
Select Charts, hover over the options, and pick the chart you want.
Try it! Select File > New, select Take a tour, and then select the Chart Tab. For more information, see Create charts.
Use conditional formatting
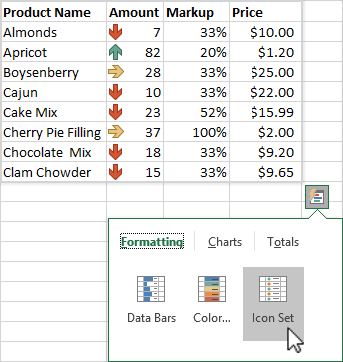
Use Quick Analysis to highlight important data or show data trends.
-
Select the data to conditionally format.
-
Select the Quick Analysis button
-
Select Formatting, hover over the options, and pick the one you want.
Try it! Select File > New, select Take a tour, and then select the Analyze Tab.


Need more help?
Want more options?
Explore subscription benefits, browse training courses, learn how to secure your device, and more.


Communities help you ask and answer questions, give feedback, and hear from experts with rich knowledge.


