
A Totals row in Access helps you see, at a quick glance, what the totals are for columns on a datasheet. For example, in a table of purchase information, we can show the sum of the price, or units purchased, or a total count of the items by adding a Totals row to the datasheet:

Note: To show the Sum value for a column, the column’s data type has to be set to Number, Decimal or Currency. For non-numeric columns, you can only select the Count total type.
Add a Totals row
-
Double-click the table, query, or split form from the Navigation Pane to open it in Datasheet View.
-
On the Home tab, in the Records group, click Totals.
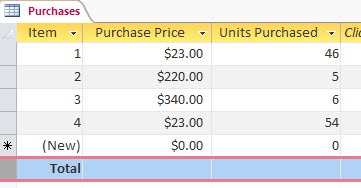
A Total row is added at the end of your datasheet:
-
For each cell in the Total row where you want a total to appear, click in the cell and select the kind of total you want.
Selecting the total type
After adding the Total row, you select what type of totals value is displayed for each column. For example, aggregates like sums can be displayed when the data type is set to Number, Decimal, or Currency. A count of values is possible when the data type is a text value.
Let’s have the datasheet in this example show us the total sum value for the Purchase Price and Units Purchased columns and the total count for the Item column in the image below:
-
Instead of the word Total in the first column, we can show a total record count. Click the totals row for the Item column, click the arrow and select Count to see the total number or count of items.
-
Next, click the arrow in the Purchase Price column and select Sum to see the total purchase price of all items.
-
Repeat the previous step for the Unit Purchased column to see the totals for the units purchased.

Note: Though the Total row can’t be deleted or cut, it can be hidden by clicking Totals on the Home tab.
Understand Sum and the other aggregate functions
Aggregate functions perform calculations on columns of data and return a single result. You use aggregate functions when you need to calculate a single value, such as a sum or an average. As you proceed, remember that you use aggregate functions with columns of data. That may seem like an obvious statement, but when you design and use a database, you tend to focus on rows of data and individual records — you make sure that users can enter data in a field, move the cursor to the right or left and fill in the next field, and so on. In contrast, you use aggregate functions to focus on groups of records in columns.
For example, suppose you use Access to store and track sales data. You can use aggregate functions to count the number of products sold in one column, calculate total sales amounts in a second column, and calculate the average sales amount for each product in a third column.
This table lists and describes the aggregate functions that Access provides in the Totals row. Remember that Access provides additional aggregate functions, but you must use them in queries.
|
Function |
Description |
Use with the data type(s) |
Available in Totals row? |
|
Average |
Calculates the average value for a column. The column must contain numeric, currency, or date/time data. The function ignores null values. |
Number, Decimal, Currency, Date/Time |
Yes |
|
Count |
Counts the number of items in a column. |
All data types except complex repeating scalar data, such as a column of multivalued lists. For more information about multivalued lists, see the articles Guide to multivalued fields and Create or delete a multivalued field. |
Yes |
|
Maximum |
Returns the item with the highest value. For text data, the highest value is the last alphabetic value; and Access ignores case. The function ignores null values. |
Number, Decimal, Currency, Date/Time |
Yes |
|
Minimum |
Returns the item with the lowest value. For text data, the lowest value is the first alphabetic value; and Access ignores case. The function ignores null values. |
Number, Decimal, Currency, Date/Time |
Yes |
|
Standard Deviation |
Measures how widely values are dispersed from an average value (a mean). For more information, see More about the Standard Deviation and Variance functions, in the next section. |
Number, Decimal, Currency |
Yes |
|
Sum |
Adds the items in a column. Works only on numeric and currency data. |
Number, Decimal, Currency |
Yes |
|
Variance |
Measures the statistical variance of all values in the column. You can use this function only on numeric and currency data. If the table contains less than two rows, Access returns a null value. For more information about variance functions, see More about the Standard Deviation and Variance functions, in the next section. |
Number, Decimal, Currency |
Yes |
More about the Standard Deviation and Variance functions
The Standard Deviation and Variance functions compute statistical values. Specifically, they calculate where values are clustered around their mean (their average) in a standard distribution (a bell curve).
For example, suppose you randomly collect 10 tools stamped from the same machine and measure them for breaking strength — a process that tests the machine and your quality control measures. If you compute an average breaking strength, you can see that most of the tools have a breaking strength that is close to that average, while a few have a greater strength and a few have a lesser strength. However, if you only compute the average breaking strength, that value does not tell you how well your quality control process works, because a few exceptionally strong or weak tools can skew the average up or down.
The Variance and Standard Deviation functions work around that problem by telling you how close your values are to the mean. For breaking strength, the smaller the numbers returned by either function indicate that your manufacturing processes are working well, because few of the tools have a breaking strength above or below the average.
A complete discussion of variance and standard deviation is beyond the scope of this article. You can consult any number of statistics Web sites for more information about both topics. Remember these rules as you use the Variance and Standard Deviation functions:
-
The functions ignore null values.
-
The Variance function uses this formula:

-
The Standard Deviation function uses this formula:


