
A PerformancePoint dashboard usually displays a high-level picture of organization performance, but you may be looking for a specific bit of information that is not in view. To find exactly what you need, you may need to apply filters to the reports on the dashboard. The ability to filter data is one of the significant benefits of using a PerformancePoint dashboard.
Filters on a PerformancePoint dashboard are created by the dashboard author, the individual who creates the dashboard. They are available for your use when you view the dashboard on a SharePoint site.
A PerformancePoint dashboard can have multiple filters that work together to enable you to restrict your view of the data on the dashboard to just what you want to see. But, you do need to understand how the connections between them work and how the filters affect what you see.
What do you want to know about?
Connections between filters and scorecards or reports
Each filter is connected to one or more reports or scorecards on the dashboard. If you apply a filter on a dashboard, every report or scorecard that is connected to it will update, but reports and scorecards that are not connected to the filter will remain unchanged.
Tip: If you apply a filter and then open a scorecard or report in a new window, the filter applies in the new window, too. It also applies to reports that you export to Microsoft Office Excel or PowerPoint.
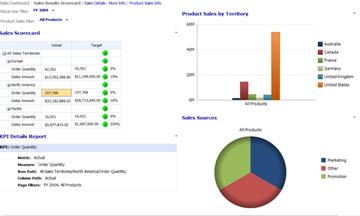
The dashboard in the following example displays four reports—a scorecard, an analytic chart, a KPI Details report, and a pie chart. The dashboard contains two filters at the top. One enables you to restrict data to a specific fiscal year and the other enables you to restrict the number and types of products you want to view. If you select a specific fiscal year, every report on the dashboard page that is linked to the Fiscal Year filter will update. If you use the Product Sales filter to choose specific products, each report that is connected to the Products filter will update.
In this example, the Sales Scorecard is linked to the Fiscal Year Filterand the KPI Details Report is linked to the Sales Scorecard.Product Sales by Territory and Sales Sources reports are linked to the Product Sales filter.
Sequence of filters
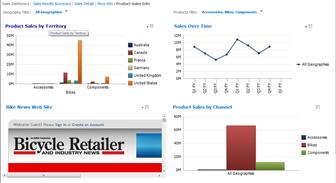
You can select values from each filter, independently, to answer a variety of questions. Choose your filters in the sequence that you want to pursue. For example, if your primary focus is on finding out how certain products are performing, apply a Product filter before you apply any other filter. After the Product filter is applied, you might want to look at how that product performed in a specific country or region. You can then apply a Geography filter. In the following example, the Products filter was applied first, and then the Geography filter. Because the selected filters included All Products, Bikes and All Geographies, Canada, you can see:
-
How bike sales performed in Canada
-
How sales of all products performed in Canada
-
How bikes performed in comparison to all products
-
How sales in Canada compared to sales in all geographies
How to clear a filter
-
Click the filter drop-down symbol

-
Depending on how the filter is configured, do one of the following.
-
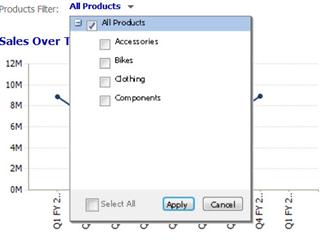
If you see an expandable tree control that includes check boxes , clear all items that are included in the filter and then click OK or Apply.
-
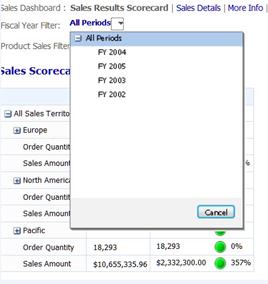
If you see a list control , select the top-level item in the list. For example, if you are using a Fiscal Year filter and the filter includes a list of years and an item called All Periods, select All Periods.
-


