
You can synchronize data from SharePoint 2010 task lists or issues tracking lists with a Visio 2010 PivotDiagram. The PivotDiagram is connected to the SharePoint list and you can refresh the data in the PivotDiagram to retrieve up-to-date data from the list.
Notes:
-
You must have Visio Professional 2010 or Visio Premium 2010 installed on your computer in order to use this SharePoint feature.
-
This feature is enabled for SharePoint Task Lists or Issues Tracking Lists only.
-
For more information about how to use Visio Pivot diagrams, see Create a PivotDiagram.
What do you want to do?
Create a PivotDiagram from a list
-
Navigate to the site that contains the list that you want to add an item to.
-
Click Site Actions, click View All Site Content, and then in the appropriate list section, click the name of the list.
-
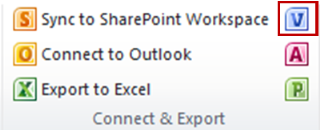
On the List tab, in the Connect & Export group, click Create Visio Diagram.
-
Visio opens and creates a multipage PivotDiagram.
View list items in a PivotDiagram
The default Visio PivotDiagram created from a SharePoint list contains three pages:
-
If you use an Issues Tracking List to create a PivotDiagram, the default diagram includes Issues Status, Workload Distribution, and Active Issues by Assign To pages.
-
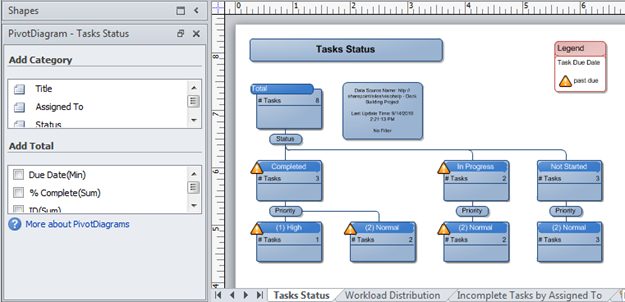
If you use a Tasks List to create a PivotDiagram, the default diagram includes Tasks Status, Workload Distribution, and Incomplete Tasks by Assigned To pages.
Create new shapes for column data
When you create a PivotDiagram from a SharePoint list, Visio creates shapes that represent aggregates of list items, grouped by columns. Each shape can then be further expanded into additional shapes that represent values in other columns.
For example, if your SharePoint Tasks List includes one or more items that have a value of “Completed” in the Status column, then the Visio PivotDiagram can display a “Completed” status shape on the Tasks Status page below the “Total” shape. The “Completed” shape represents all items in the list that have a status of “Completed.” If you select that shape and pivot on the Assigned To column, Visio creates new shapes under the “Completed” shape for each of the resources in the Assign To column that have completed a task.
To create new PivotDiagram shapes to represent column data, do the following:
-
In the Visio diagram, select the shape that you want to pivot on.
-
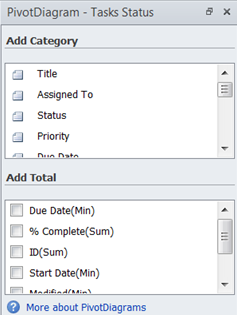
In the PivotDiagram - <List Type> Status window, under Add Category, click the column that you want to filter.
Display totals on a shape
Each shape in a Visio PivotDiagram can represent multiple items in a SharePoint list. You can display totals, item count, minimum values, or maximum values for columns on shapes in the PivotDiagram.
For example, if you create a PivotDiagram from a SharePoint Tasks List and pivot on the task status, you can display the earliest due date for all tasks with a status of “In Progress” by selecting the “In Progress” shape and applying the Due Date(Min) total to the shape.
To display column totals on a PivotDiagram shape, do the following:
-
In the Visio diagram, select the shape that you want.
-
In the PivotDiagram - <List Type> Status window, under Add Total, select the kind of total that you want to display.


