
When working with a PivotTable, you can display or hide subtotals for individual column and row fields, display or hide column and row grand totals for the entire report, and calculate the subtotals and grand totals with or without filtered items.

-
In a PivotTable, select an item of a row or column field. Make sure it is a field and not a value.
-
On the PivotTable Analyze tab, in the Active Field group, click Field Settings.
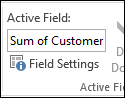
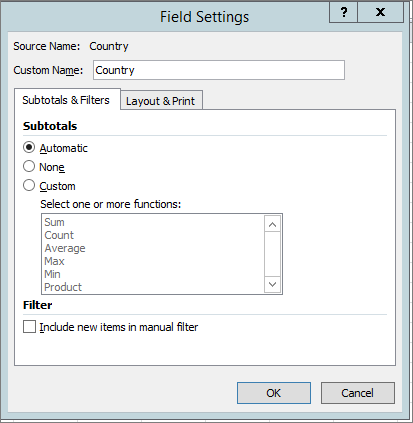
This displays the Field Settings dialog box.
-
In the Field Settings dialog box, under Subtotals, do one of the following:
-
To subtotal an outer row or column label using the default summary function, click Automatic.
-
To remove subtotals, click None.
Note: If a field contains a calculated item, you can't change the subtotal summary function.
-
To use a different function, to display more than one type of subtotal, or to subtotal an inner row or column label, click Custom (if this option is available), and then select a function.
Functions that you can use as a subtotal
Function
Description
Sum
The sum of the values. This is the default function for numeric data.
Count
The number of data values. The Count summary function works the same as the COUNTA function. Count is the default function for data other than numbers.
Average
The average of the values.
Max
The largest value.
Min
The smallest value.
Product
The product of the values.
Count Numbers
The number of data values that are numbers. The Count Numbers summary function works the same as the worksheet COUNT function.
StDev
An estimate of the standard deviation of a population, where the sample is a subset of the entire population.
StDevp
The standard deviation of a population, where the population is all of the data to be summarized.
Var
An estimate of the variance of a population, where the sample is a subset of the entire population.
Varp
The variance of a population, where the population is all of the data to be summarized.
Note: You cannot use a custom function that uses an Online Analytical Processing (OLAP) data source.
-
-
To include or exclude new items when applying a filter in which you have selected specific items in the Filter menu, select or clear the Include new items in manual filter check box.
Tips:
-
To quickly display or hide the current subtotal, right-click the item of the field, and then select or clear the check box next to Subtotal "<Label name>".
-
For outer row labels in compact or outline form, you can display subtotals above or below their items, or hide the subtotals, by doing the following:
-
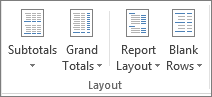
On the Design tab, in the Layout group, click Subtotals.
-
Do one of the following:
-
Select Do Not Show Subtotals.
-
Select Show all Subtotals at Bottom of Group.
-
Select Show all Subtotals at Top of Group.
-
-
You can display or hide the grand totals for the current PivotTable. You can also specify default settings for displaying and hiding grand totals
Display or hide grand totals
-
Click anywhere in the PivotTable.
-
On the Design tab, in the Layout group, click Grand Totals, and then select the grand total display option that you want.
Change the default behavior for displaying or hiding grand totals
-
Click the PivotTable.
-
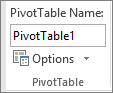
On the PivotTable Analyze tab, in the PivotTable group, click Options.
-
In the PivotTable Options dialog box, on the Totals & Filters tab, do one of the following:
-
To display grand totals, select either Show grand totals for columns or Show grand totals for rows, or both.
-
To hide grand totals, clear either Show grand totals for columns or Show grand totals for rows, or both.
-
-
Click anywhere in the PivotTable.
-
On the PivotTable Analyze tab, in the PivotTable group, click Options.
-
In the PivotTable Options dialog box, on the Total & Filters tab, do one of the following:
-
For Online Analytical Processing (OLAP) source data, do one of the following:
-
Select or clear the Subtotal filtered page items check box to include or exclude report filter items.
Note: The OLAP data source must support the MDX expression subselect syntax.
-
Select or clear the Mark totals with * check box to display or hide an asterisk next to totals. The asterisk indicates that the visible values that are displayed and that are used when Excel calculates the total are not the only values that are used in the calculation.
Note: This option is only available if the OLAP data source does not support the MDX expression subselect syntax.
-
-
For non-OLAP source data, select or clear the Allow multiple filters per field check box to include or exclude filtered items in totals.
-


