Visio helps you draw diagrams that communicate complex information at a glance.
Visio is available in two forms, depending on which plan you have:
|
Description |
Available in which plan*? |
Get it |
|---|---|---|
|
The full-featured Windows-based app |
Plan 2 |
|
|
A simpler, browser-based app you can use on Windows or macOS; no download necessary |
Plan 2 Plan 1 Visio in Microsoft 365 |
|


* Not sure which license you have? Follow these instructions for checking your license.
Try out Visio in your browser
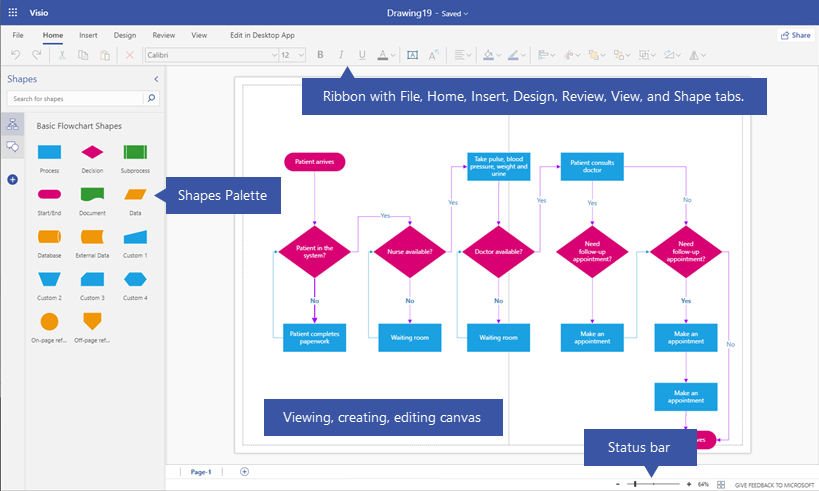
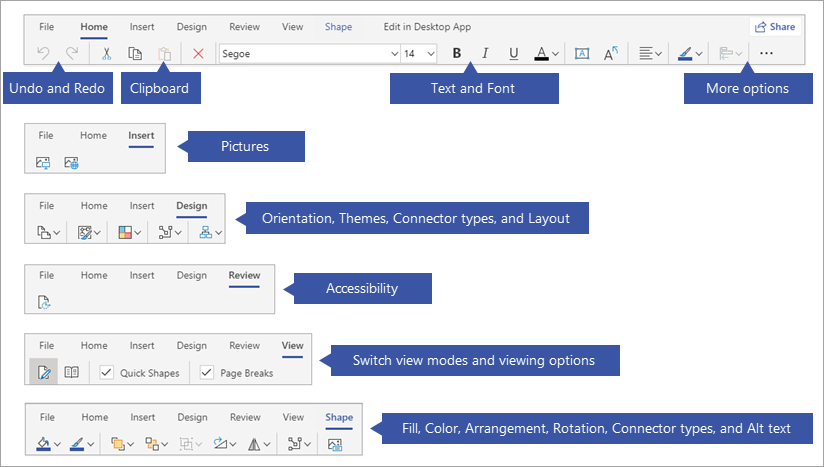
Click each tab below to get a visual overview of creating and editing a diagram in Visio for the web.
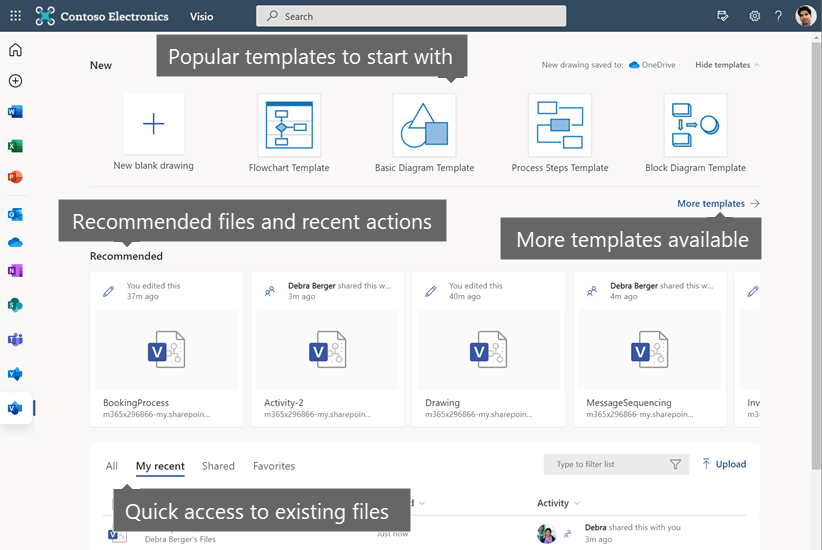
To see this home page, sign in at office.com with your work or school account.
More templates
When you select More templates, you are taken to a new page which shows many templates and starter diagrams that you can browse through or search.
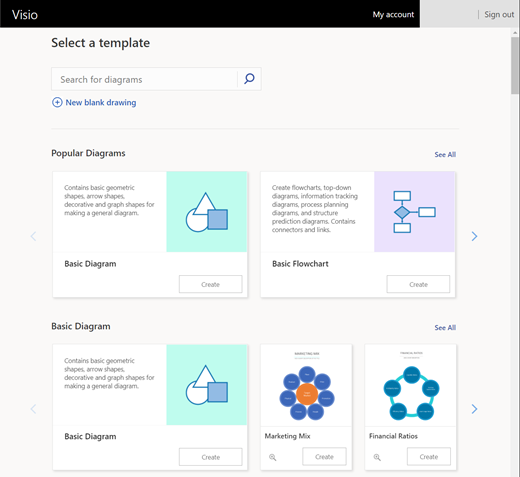
(If you have a Government Community Cloud subscription, the Search for diagrams option pictured above near the upper left isn't available. However, you can still browse the page or use your web browser's Search tool to look for a template or sample by name.)

Each diagram has several real-world samples to help you quickly get started. Check back from time to time, as diagrams are continuously added based on your feedback!
|
Diagram |
Description |
|
|---|---|---|
 |
Basic Diagram |
Contains basic geometric shapes, arrow shapes, decorative shapes, and graph shapes for making a general diagram. |
 |
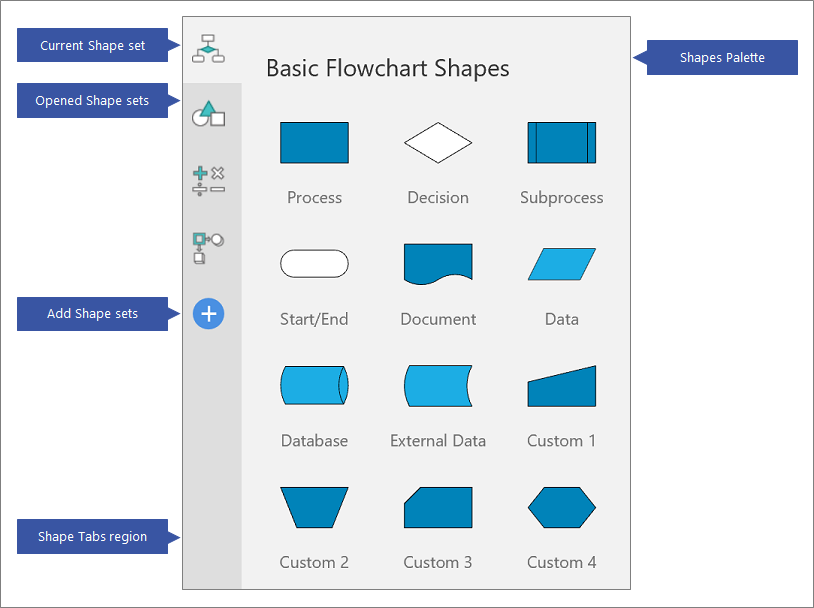
Basic Flowchart |
Contains flowcharts, top-down diagrams, information tracking diagrams, process planning diagrams, and structure prediction diagrams. Contains connectors and links. |
 |
Cross-Functional Flowchart |
Shows the relationship between a business process and the organizational or functional units, such as departments, that are responsible for steps in that process. |
 |
Azure |
Represents features of systems that use the Microsoft Azure cloud platform and its related technologies. |
|
|
UML |
Represents a software system or model, such as the messages that pass between participants and objects in a system, or the interactions of users or components with a system. |
 |
Network |
Create detailed physical, logical, and network architecture diagrams, using a comprehensive set of network and computer equipment shapes. |
|
|
SDL |
Contains object-oriented diagrams for communications and telecommunications systems and networks, using the Specification and Description Language (SDL). Based on CCITT specifications. |
|
|
Block |
Contains 2-D and 3-D shapes and directional lines for feedback loops and annotated functional decomposition, data structure, hierarchical, signal flow, and data flow block diagrams. |
 |
Process |
Contains "process steps" shapes to illustrate sequence of steps involved in a process or a procedure. Represents business flow, information flow, material flow, vertical or horizontal lists. Contains arrows to show the direction and captions. |
 |
Business Matrix |
Contains business matrix diagrams that show relationships between concepts across two or more dimensions and includes: 2x2 and 3x3 matrixes, SWOT analysis, Ansoff matrix, BCG matrix, position maps, and Quadrant analysis diagrams. |
 |
Venn |
Uses overlapping shapes to depict possible logical relationships between two or more sets to organize information, show associations, similarities, unions, intersections, differences, containments, and complements. |
 |
Cycle |
Represents a sequence of stages, tasks, or events in a circular flow. Contains circular, radial, target, circular segments, pie segments, loops and other cyclic diagram shapes. |
 |
Pyramid |
Uses triangular, pyramidal or conical shapes to show proportional, interconnected, and hierarchical relationships. |