
Scorecards are used to show performance for one or more items, such as key performance indicators (KPIs) by comparing actual results to target values. Scorecards resemble tables that include graphical indicators. PerformancePoint scorecards are scorecards that are created by using PerformancePoint Dashboard Designer.
Dashboard users can explore data, apply filters, and export copies of PerformancePoint scorecards to Microsoft PowerPoint or Microsoft Excel. Simple scorecards are typically used to compare actual results to target values. However, PerformancePoint scorecards vary in complexity and can include advanced functionality.
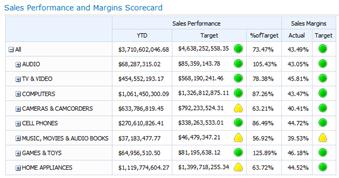
A PerformancePoint scorecard might resemble the following image:
The following list describes some of the features you might see in a PerformancePoint scorecard:
-
Trend indicators, such as arrows, that show whether performance has improved, remained the same, or decreased from a previous time period.
-
Complex KPIs that measure performance by comparing multiple values or using calculated metrics. For example, suppose that sales performance is determined not just by comparing gross sales amounts to quota, but also by factoring in gross profit margin and weighted sales metrics. You can have KPIs that show all the measures of sales performance and then calculate an overall performance measurement.
-
Time Intelligence to show performance for dynamic time periods or as of a particular date. For example, you might have a column labeled Last Six Months in your scorecard that is automatically updated.
-
Expandable and collapsible rows or columns that you can use to see lower or higher levels of detail in the scorecard. For example, suppose that you have an item called All Products on rows in your scorecard. Depending on how the scorecard is configured, you can click Products and see the next level of detail. The scorecard updates and displays additional rows, one for each item in the Products group.
-
KPIs that are used as filters for other reports, such as analytic charts or grids in a dashboard. For example, suppose that you have a scorecard that is connected to an analytic chart. When you click a KPI, the analytic chart automatically updates to display information that is relevant to that KPI. When you click another KPI, the report updates again to display information for that KPI, and so on.
-
The ability to open a Decomposition Tree to analyze how individual members contribute to a value. Depending on how the scorecard is configured and if it uses SQL Server Analysis Services data, you can right-click value and then click Decomposition Tree.
PerformancePoint scorecards can use data that is stored in any of the following data sources:
-
SQL Server Analysis Services
-
A SharePoint List
-
An Excel Services file
-
A table in SQL Server
-
A list of values that is created by the scorecard author


