In Power Query, you can group the same values in one or more columns into a single grouped row. You can group a column by using an aggregate function or group by a row.
Example
The following procedures are based on this query data example:
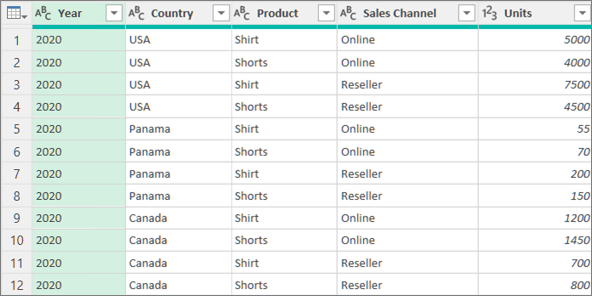
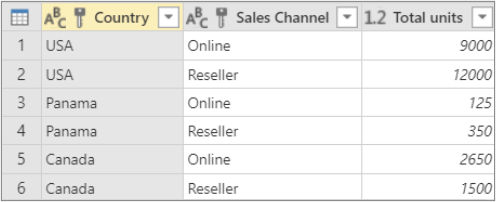
You can group data by using an aggregate function, such as Sum and Average. For example, you want to summarize the total units sold at the country and sales channel level, grouped by the Country and Sales Channel columns.
-
To open a query, locate one previously loaded from the Power Query Editor, select a cell in the data, and then select Query > Edit. For more information see Create, edit, and load a query in Excel.
-
Select Home > Group by.
-
In the Group by dialog box, select Advanced to select more than one column to group by.
-
To add another column, select Add Grouping.
Tip To delete or move a grouping, select More (…) next to the grouping name box. -
Select the Country and Sales Channel columns.
-
In the next section:
New column name Enter "Total units" for the new column header.
Operation Select Sum. The aggregations available are Sum, Average, Median, Min, Max, Count Rows, and Count Distinct Rows.
Column Select Units to specify which column to aggregate. -
Select OK.
Result
A Row Operation does not require a column, because data is grouped by a row in the Group By dialog box. There are two choices when you create a new column:
Count Rows
which displays the number of rows in each grouped row.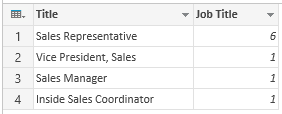
All Rows An inner Table value is inserted. It contains all the rows for the columns you grouped by. You can later expand the columns if you want. For more information, see Work with a List, Record, or Table structured column.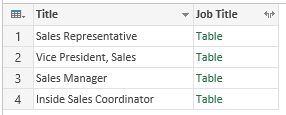
Procedure
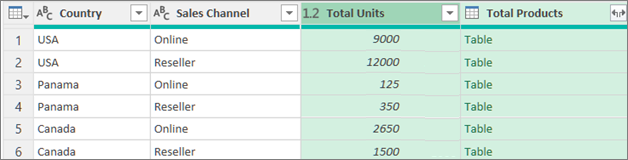
For example, to group by all rows, you want the total units sold and you want two other columns that give you the name and units sold for the top-performing product, summarized at the country and sales channel level.
-
To open a query, locate one previously loaded from the Power Query Editor, select a cell in the data, and then select Query > Edit. For more information see Create, load, or edit a query in Excel.
-
Select Home > Group by.
-
In the Group by dialog box, select Advanced to select more than one column to group by.
-
Add a column to aggregate by selecting Add aggregation at the bottom of the dialog box.
Tip To delete or move an aggregation, select More (…) next to the column box. -
Under Group by, select the Country and Sales Channel columns.
-
Create two new columns by doing the following:
Aggregation Aggregate the Units column by using the Sum operation. Name this column Total units.
All rows Add a new Products column by using the All rows operation. Name this column Total products. Because this operation acts upon all rows, you don’t need to make a selection under Column and so it is not available. -
Select OK.
Result