
Your organization has data, lots of data, and probably stores that data in a variety of formats, such as databases, e-mail messages, and spreadsheet files. The Business intelligence Center site and its tools help you organize that data in a useful way and present that data as meaningful information.
The Business Intelligence Center is a pre-built Web site, or site template, that is optimized to help you manage the working elements of business intelligence (BI) reporting: scorecards, dashboards, data connections, status lists, status indicators, and so on. You can customize a Business Intelligence Center site as much as you like, or you can just start by using its built-in tools.
The Business Intelligence Center is a great place to start. You can see examples of key BI elements, such as an Excel Services workbook for analysis, charts, and different kinds of dashboards. And, to learn more about any example, you can click on conveniently located links that connect to articles with more information. In addition, special-purpose libraries are ready for you to use to create data connections, manage content for PerformancePoint Services or SharePoint BI, and store finished dashboards.
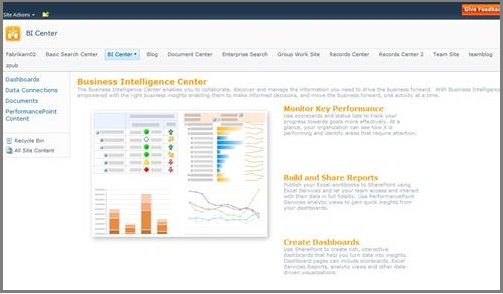
The Business Intelligence home page has two main panels: information resources in the center panel, and links to pre-built libraries in the Quick Launch panel on the left side of the screen.
In this article
The center panel – examples and links to helpful information
The center panel of the Business Intelligence Center home page gives you a quick overview of its special features. In general, the information panels provide examples of BI tools such as status indicators, analytic tools and spreadsheets, and dashboards. You can find information on the simple but powerful tools that are part of every SharePoint installation with an Enterprise license. In addition, these information panels contain links to information about PerformancePoint Services, which offer extremely powerful and sophisticated tools for performance monitoring and analysis.
|
Section |
Description |
|---|---|
|
Monitor Key Performance |
In the Monitor Key Performance panel, you can find links to information about different approaches to monitoring performance, SharePoint Status Lists and scorecards in PerformancePoint Services.
|
|
Build and Share Reports |
In the Build and Share Reports panel, you can find links to information about Excel Services, and about the interactive visualization tools in PerformancePoint Services.
|
|
Create Dashboards |
In the Create Dashboards panel, you can find links to information about how to create dashboards by using tools in SharePoint alone, or by using tools in PerformancePoint Services. The links in this panel include Start using PerformancePoint Services, which opens a home page for PerformancePoint Services. To start right away, you can click Run ‘Dashboard Designer or you can follow links to Getting Started articles that can help you create scorecards, decomposition trees, dashboards, and analytic charts and grids. |
Dashboard library
At its most basic level, a dashboard is a just Web Part page that contains a collection of indicators, data, or graphics. Thus, the Dashboards library is a library that is optimized to store and create Web Part pages. This includes PerformancePoint dashboards and Web Part pages with Status Lists for SharePoint status indicators.
When you create a dashboard by using Dashboard Designer, PerformancePoint Services automatically stores the dashboard in the Dashboards library. You can import dashboards that were created previously by using PerformancePoint Services, or use the Ribbon commands on the Dashboard list page to create a new dashboard from a Web Part page. For information about how to create a dashboard or other BI feature in PerformancePoint Services, see Getting Started: PerformancePoint Dashboard Designer.
You can also use Ribbon commands on the Dashboard list page to create a Web Part page with Status List to display SharePoint status indicators, and then add charts, filters, and other content web parts as needed. For more information about how to create a Web Part page with Status Lists, see Getting started with SharePoint status indicators.
Data Connections library
The Data Connection library enables you to specify data source connections once, and then re-use them in any Web Part on the site. The Data Connection library supports PerformancePoint Data Sources, Office Data Connection (.odc) Files, and Universal Data Connection (UDC) files.
For information about creating an Office Data Connection file, see Introduction to importing and exporting data.
For information about how to create a data source or other BI feature in PerformancePoint Services, see Getting Started: PerformancePoint Dashboard Designer.
Documents library
The Documents library serves as a central library for spreadsheets, SharePoint lists, text documents, and so on. To help make information easier to find, you can create folders within this library. For example, you might want to create a folder for “Excel Reports - financial”, or “Status Lists for tracking”,
You can also create custom libraries. For more information, see Introduction to libraries.
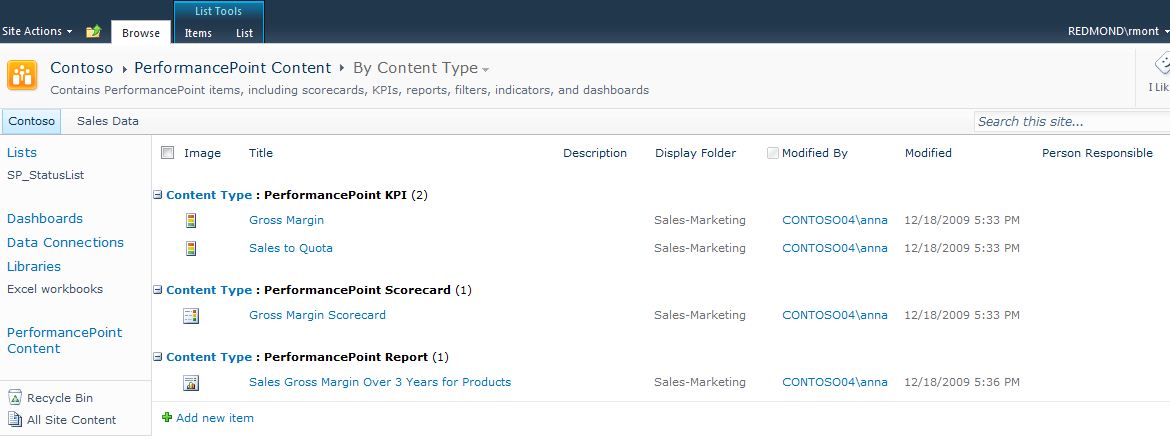
PerformancePoint Content list
The PerformancePoint Content list is designed to store the PerformancePoint Services scorecard and report elements that an analyst creates by using Dashboard Designer. For example, this illustration shows a PerformancePoint Content library that contains Key Performance Indicators (KPIs), a scorecard, and a report.
Create a new Business Intelligence Site
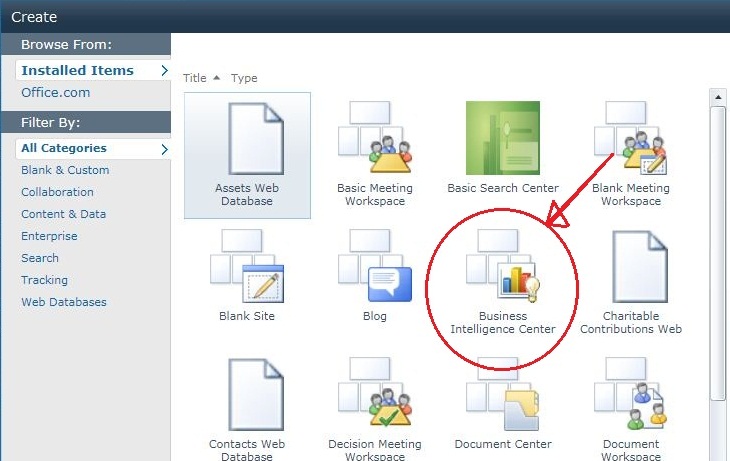
SharePoint Site Owners can create a Business Intelligence Center at any time by selecting the Business Intelligence Center site template in the New Site dialog box.
To customize what data can be viewed by whom, you can connect a variety of Filter Web Parts to existing Web Parts on a dashboard page to change the view of the data. For example, a sales manager for one region can be presented with a view of sales figures different from the view for a sales manager for another region.
Next Steps
-
To learn more about dashboards, see Getting started with dashboards
-
To learn more about SharePoint business intelligence, see What is SharePoint business intelligence?


