Sign in with Microsoft
Sign in or create an account.
Hello,
Select a different account.
You have multiple accounts
Choose the account you want to sign in with.

Exploring charts in Excel and finding that the one you pick isn’t working well for your data is a thing of the past! Try the Recommended Charts command on the Insert tab to quickly create a chart that’s just right for your data.

  1. Select the data you want to chart.

    Selecting more data for an Office chart

  2. Click the Insert tab, and then do one of the following:

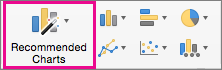
    • Click Recommended Charts and select the chart type you want.

      Excel for Mac Recommended Charts Ribbon Command

      OR

    • Click a specific chart type and select the style you want.

      Choose another type of chart
  3. With the chart selected, click the Chart Design tab to do any of the following:

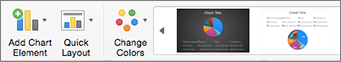
    • Click Add Chart Element to modify details like the title, labels, and the legend.

      Chart design tab left half
    • Click Quick Layout to choose from predefined sets of chart elements.

    • Click one of the previews in the style gallery to change the layout or style.

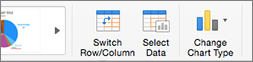
    • Click Switch Row/Column or Select Data to change the data view.

      Chart design tab right half
    • Click Change Chart type to switch to a different kind of chart.

Select data for a chart

Structure data for specific types of charts

Format data labels in a chart in Office for Mac

Add data series in charts

Need more help?

Want more options?

Explore subscription benefits, browse training courses, learn how to secure your device, and more.

Communities help you ask and answer questions, give feedback, and hear from experts with rich knowledge.

Was this information helpful?

What affected your experience?
By pressing submit, your feedback will be used to improve Microsoft products and services. Your IT admin will be able to collect this data. Privacy Statement.

Thank you for your feedback!

×