
Microsoft Power Map for Excel is a three-dimensional (3-D) data visualization tool that lets you look at information in new ways. A power map lets you discover insights you might not see in traditional two-dimensional (2-D) tables and charts.
With Power Map, you can plot geographic and temporal data on a 3-D globe or custom map, show it over time, and create visual tours you can share with other people. You’ll want to use Power Map to:
-
Map data Plot more than a million rows of data visually on Bing maps in 3-D format from an Excel table or Data Model in Excel.
-
Discover insights Gain new understandings by viewing your data in geographic space and seeing time-stamped data change over time.
-
Share stories Capture screenshots and build cinematic, guided video tours you can share broadly, engaging audiences like never before. Or export tours to video and share them that way as well.
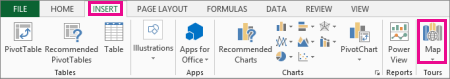
You’ll find the Map button in the Tours group on the Insert tab of the Excel ribbon, as shown in this picture.
Notes:
-
If you can’t find this button in your version of Excel, go to I don't see the Power Map button in Excel.
-
If you have a subscription for Microsoft 365 Apps for enterprise, you have access to Power Map for Excel as part of the self-service business intelligence tools. Whenever any new Power Map features and performance enhancements are released, you'll get them as part of your subscription plan.
To learn about the Microsoft 365 subscription plans, see Explore Microsoft 365 ProPlus and Compare All Microsoft 365 for Business Plans.
-
If you previously installed a preview version of Power Map, you’ll temporarily have two Map buttons on the Insert tab: one in the Tours group and one in the Power Map group. Clicking the Map button in the Tours group enables the current version of Power Map and uninstalls any preview versions.
Create your first Power Map
When you have Excel data that has geographic properties in table format or in a Data Model—for example, rows and columns that have names of cities, states, counties, zip codes, countries/regions, or longitudes and latitudes—you’re ready to get started. Here’s how:
-
In Excel, open a workbook that has the table or Data Model data you want to explore in Power Map.
For information about preparing your data, see Prepare your data for Power Map.
To see some example datasets, scroll down to the next section of this article. -
Click any cell in the table.
-
Click Insert > Map. Clicking Map for the first time automatically enables Power Map.
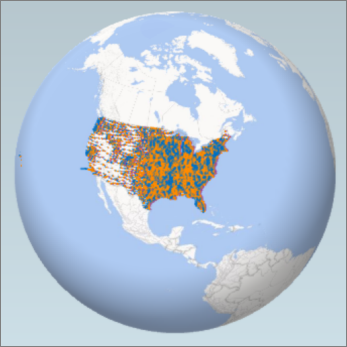
Power Map uses Bing to geocode your data based on its geographic properties. After a few seconds, the globe will appear next to the first screen of the Layer Pane. -
In the Layer Pane, verify that fields are mapped correctly and click the drop-down arrow of any incorrectly mapped fields to match them to the right geographic properties.
For example, make sure that Zip Code is recognized as Zip in the drop-down box.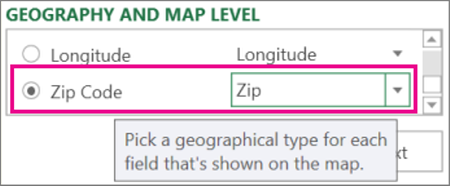
-
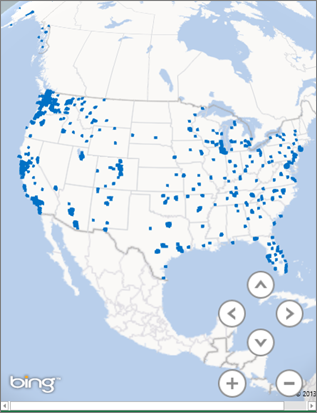
When Power Map plots the data, dots appear on the globe.
-
Click Next to start aggregating and further visualizing your data on the map.
Explore sample datasets in Power Map
Our sample datasets are a great way to try out Power Map. Just download one of the following workbooks that already have the necessary geo-spatial entries you need to get started. Both the Dallas Utilities, and Food Inspections in Seattle downloads have time-stamped data, which allow you to view data over time.


