
Note: This article has done its job, and will be retiring soon. To prevent "Page not found" woes, we're removing links we know about. If you've created links to this page, please remove them, and together we'll keep the web connected.
After you create an organization chart, you can use different formatting options to make it look the way you want it to.
What do you want to do?
Change a solid line to a dotted line
To show a dotted-line reporting relationship between two boxes, change the style of the line between the two boxes.
-
Right-click the line you want to change, and then click Format Shape on the shortcut menu.
-
In the Format Shape pane, if necessary, click the arrow next to Line, and then select the Dash type that you want.
Tip: To select multiple lines, press CTRL and click on each line that you want to change.
Change the colors of your organization chart
You can apply color combinations that are derived from the theme colors to the boxes in your SmartArt graphic.
-
Click a box in the SmartArt graphic whose color you want to change.
-
Under SmartArt Tools, on the Design tab, in the SmartArt Styles group, click Change Colors.
If you do not see the SmartArt Tools or Design tabs, make sure that you have selected a SmartArt graphic. You may have to double-click the SmartArt graphic to select it and open the Design tab.
-
Click the color combination that you want.
Tip: When you place your pointer over a thumbnail, you can see how the colors affect your SmartArt graphic.
Change the background color of a box in your organization chart
-
Right-click the border of a box, and then click Format Shape on the shortcut menu.
-
In the Format Shape pane, under Fill, click Solid fill.
-
Click Color

-
To specify how much you can see through the background color, move the Transparency slider, or enter a number in the box next to the slider. You can vary the percentage of transparency from 0% (fully opaque, the default setting) to 100% (fully transparent).
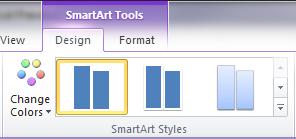
Apply a SmartArt Style to your organization chart
A SmartArt Style is a combination of various effects, such as line style, bevel, or 3-D that you can apply to the boxes in your SmartArt graphic to create a unique and professionally designed look.
-
Click a box in the SmartArt graphic whose SmartArt Style you want to change.
-
Under SmartArt Tools, on the Design tab, in the SmartArt Styles group, click the SmartArt Style that you want.
To see more SmartArt Styles, click the More button
If you do not see the SmartArt Tools or Design tabs, make sure that you have selected a SmartArt graphic. You may have to double-click the SmartArt graphic to select it and open the Design tab.
Notes:
-
When you place your pointer over a thumbnail, you can see how the SmartArt Style affects your SmartArt graphic.
-

Tip: If you’re using Microsoft PowerPoint 2013, you can animate your organization chart to emphasize each box, each branch, or each hierarchical level. See Animate a SmartArt graphic.


