
You can use PerformancePoint Dashboard Designer to create scorecards for your dashboards. A scorecard can be thought of as a kind of report that is designed to show at a glance whether performance is on or off target for one or more key performance indicators (KPIs).
-
For a quick overview of how to create a PerformancePoint scorecard, see How are PerformancePoint scorecards built?
-
For more detailed information on how to create a PerformancePoint scorecard, see Create a scorecard by using Dashboard Designer on TechNet
Read this article to get an overview of PerformancePoint scorecards and how to create scorecards for your organization.
In this article
What is a scorecard?
A scorecard is a high-level snapshot of organizational performance. Scorecards display a collection of key performance indicators (KPIs) and the performance targets for those KPIs. When you create a scorecard, you typically create an upper-level group of objectives that represent the various performance goals for a group or an organization. Then, you can populate those objectives with other KPIs that represent the sub-objectives for each KPI.
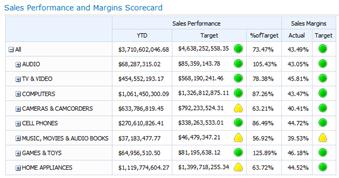
A scorecard that you create by using Dashboard Designer might resemble the following image:
Scorecards are as varied as the organizations they represent. For example, a retail business might measure performance by reporting sales volume. Or, a city government organization might track the number of citizens who attend community meetings. You can create scorecards for an individual team, or for an entire organization.
For more detailed information about scorecards, see Overview of PerformancePoint scorecards.
What’s in a PerformancePoint scorecard?
PerformancePoint scorecards vary in complexity and content, but they generally consist of the following elements:
|
Item |
Description |
|
Data source(s) |
A data source is a connection to an underlying database. PerformancePoint KPIs can use multiple data sources, including the following kinds of data sources:
You can create a PerformancePoint scorecard that contains a variety of KPIs that use the same or different data sources. However, when you use a wizard to create a scorecard, you begin by selecting a single data source for the first KPI. You can then add KPIs that use other data sources by editing the scorecard after you have created it. |
|
Indicators |
Indicators are the graphical symbols that you use in KPIs to show whether performance is on or off target. There are many different kinds of indicators, including gauges, smiley faces, stoplights, and trend arrows. Indicators are organized into two groups: centered and standard.
|
|
KPIs |
KPIs can be thought of as the success measures that you see in your scorecard. KPIs are used to compare actual results to target values. For example, if you are creating a scorecard for a sales team, you might have a KPI to show sales amounts compared to quota amounts. Depending on the data source that you use for your scorecard, you can either import KPIs from the data source, or you can create your own KPIs. |
|
Rows and columns |
Scorecards resemble tables that have at least one row and one column. Most dashboard authors create scorecards that have items on rows and either time periods or metrics on columns. |
How are PerformancePoint scorecards built?
When you create a PerformancePoint scorecard, you can either use a wizard to step you through the process or you can create your scorecard manually. For more information, see Create a scorecard by using Dashboard Designer on TechNet.
Regardless of the method that you use, you have many configuration options available to you. You can create a simple scorecard that compares actual results to target values. Or, you can create sophisticated scorecards that include advanced functionality, such as Time Intelligence or calculated KPIs.
This section provides you with a high-level overview of how to create a scorecard, but it does not cover all the configuration options that are available to you. For more detailed information, see Create a scorecard by using Dashboard Designer on TechNet.
Create a scorecard by using the wizard
-
To open the wizard, locate the Workspace Browser, and then click PerformancePoint Content. Click the Create tab, and then click Scorecards. The wizard guides you through the following process:
Tip: If the wizard does not open, then Dashboard Designer might not be configured to use the wizard. You can easily change this setting. For more information, see Turn on or off the scorecard wizard in Dashboard Designer on TechNet.
-
Select a scorecard template. The template that you select corresponds to the data source that you plan to use for your scorecard. You can choose from the following templates in Dashboard Designer:
-
In the Microsoft category, you can select Analysis Services.
-
In the Standard category, you can select Blank Scorecard or Fixed Values Scorecard.
-
In the Tabular category, you can select Excel Services, Excel Workbook, SharePoint List, or SQL Server Table.
Note: If you select the Fixed Values template, skip Step 2 and proceed to Step 3. If you select the Blank Scorecard template, do not proceed to Step 2. Instead, the wizard finishes at this point and your scorecard is open for editing in the center pane of the workspace. You then proceed to create and configure your scorecard manually.
-
Select a data source. The data source that you select must match the scorecard template that you selected. For example, if you select the Analysis Services template, then you must select an Analysis Services data source for your scorecard.
Tip: If you do not have any data sources available, then you might need to create them. For more detailed information, see on Create data connections (PerformancePoint Services) TechNet.
-
Select the KPIs. Depending on the template and the data source that you selected, you create or import the KPIs that you want to use for your scorecard. Then, you can configure each KPI by changing its name, banding method, and actual or target values.
-
Add measure filters (this is optional). Depending on the template and the data source that you selected, you might have the option to add measure filters and then add member columns. You use measure filters to restrict the information that you display in your scorecard. For example, suppose that you are creating a scorecard to show sales for some, but not all, geographical regions of an organization. You can use measure filters to select just the geographical regions that are of interest.
-
Add member columns (this is optional). Depending on whether you chose to add measure filters, you might have the option to add member columns to your scorecard. As the name suggests, member columns are items that you add to columns in your scorecard. For example, suppose that you are creating a scorecard to show sales and you selected some geographical regions for measure filters. You can add other members, such as one or more time periods, as columns in your scorecard.
-
Select a KPI location. The location that you specify is the display folder for the KPIs that you use for your scorecard. When you create a scorecard, all the KPIs that you use in that scorecard appear as newly created items in the Workspace Browser. This occurs even if you import existing KPIs from the data source that you used for your scorecard.
-
Finish configuring your scorecard. When you have completed the steps in the wizard for the scorecard template that you selected, the scorecard opens in the center pane of the workspace. There, you can further configure your scorecard. For example, you can add or remove members from the rows or columns. Or, you can modify your KPIs by changing their names, actual or target values, data sources, and indicator settings. For more detailed information, see Edit a scorecard by using Dashboard Designer on TechNet.
Create a scorecard manually
When you create a scorecard manually, you start with a scorecard that does not have a data source or any content in it. To populate the scorecard, use the following procedure:
-
Locate or create the KPIs that you want to use in your scorecard. For information about how to create KPIs, see Create and configure a KPI by using Dashboard Designer.
-
Add items to your scorecard. In the Details pane, locate the KPIs, Metrics, and other items that you want to use and add them to the scorecard in the rows and columns sections. You can add KPIs that use different data sources to your scorecard. For example, you can include some KPIs that use Analysis Services data sources and other KPIs that use Excel Services or other data sources in the same scorecard.
-
Finish configuring your scorecard. Click the Edit tab, and use the toolbar commands that are available to make changes to your scorecard. As you make changes, make sure to click Update to refresh your scorecard in the center pane.
Next Steps
See the following articles and resources for more information about how to create PerformancePoint dashboard content.
Edit a scorecard by using Dashboard Designer


