
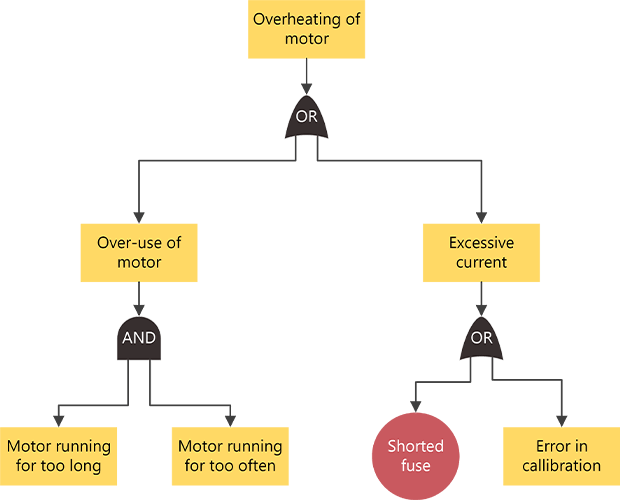
Fault tree analysis diagrams in Visio are commonly used to illustrate events that might lead to a failure so the failure can be prevented. Fault tree analysis diagrams are commonly used in Six Sigma processes, particularly in the Analyze phase of the Six Sigma business improvements process.
You begin by defining the top event (or failure). Then you can use event and gate shapes to illustrate, top-down, the process that might lead to the failure. Once you complete the diagram, you can use it to identify ways to eliminate causes of the failure and to devise corrective measures for preventing such failures.
Create a fault tree analysis diagram
-
Start Visio, and click Business > Fault Tree Analysis Diagram > Create.
-
From Fault Tree Analysis Shapes, drag the Event shape to the top of the drawing page.
-
Drag a gate shape, such as the Exclusive OR gate, onto the drawing page directly below the first event shape.
-
Continue dragging other event and gate shapes onto the page, positioning them in top-down order to identify the potential causes of the failure represented by the top-level event shape.
-
Connect the shapes.
-
Drag a shape from a stencil onto the drawing page and position it near another shape.
-
While still holding down the mouse button, move the pointer over one of the blue triangles. The triangle turns dark blue.
-
Release the mouse button. The shape is placed on the drawing page, and a connector is added and glued to both shapes.
-
-
To add text to a shape, select it, and then type. When you are finished typing, click outside the text block.
Notes:
-
To edit text, double-click the shape, place the cursor where you want to change the text, and then type.
-
To hyperlink a shape to supporting or explanatory documents, select the shape, and then, on the Insert menu, click Hyperlinks.
-
To align multiple shapes vertically or horizontally, select the shapes you want to align, then, on the Home tab > Arrange group, click Align.
-
To distribute three or more shapes at regular intervals, select the shapes, and then, on the Home tab, click Position and pick a Distribute option.
-
Create a fault tree analysis diagram
Note: In Visio for the web, fault tree analysis shapes are only available to Visio Plan 1 and Visio Plan 2 subscribers. They are not available to users of Visio in Microsoft 365.
-
Open Visio for the web.
-
Select New blank drawing.
-
In the Shapes pane, in the search box, enter fault tree, then press Enter.
-
In the results, select Fault Tree Analysis Shapes, then select Add.
-
Drag the shapes that you want to represent your business process onto the drawing page.
-
Connect the shapes as usual. For general information about connecting shapes, see Add connectors between shapes.
-
To add text to a shape, select it, and then type. When you finish typing, click outside the text block.
For information about working with shapes, see Manage shapes in Visio for the web.


