
You can instantly change the look of chart elements (such as the chart area, the plot area, data markers, titles in charts, gridlines, axes, tick marks, trendlines, error bars, or the walls and floor in 3-D charts) by applying a predefined shape style. You can also apply different shape fills, shape outlines, and shape effects to these chart elements.
-
On a chart, click the chart element that you want to change, or do the following to select it from a list of chart elements:
-
Click a chart.
This displays the Chart Tools, adding the Design, Layout, and Format tabs. -
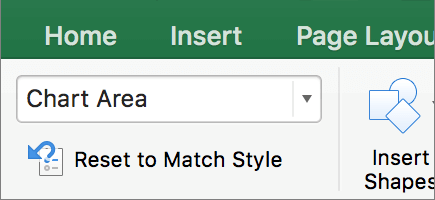
On the Format tab, in the Current Selection group, click the arrow next to the Chart Elements box, and then click the chart element that you want to use.
-
-
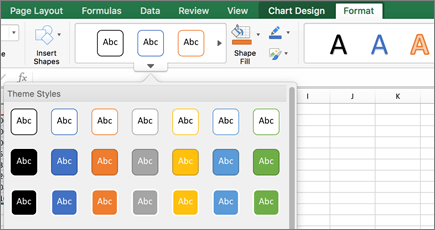
On the Format tab, in the Shape Styles group, click a predefined shape style or line style.
To see all available shape styles, Click the More button


Tip: If you don't like the change that you made, you can undo it immediately. On the Quick Access Toolbar, click Undo 

You can fill a selected shape (such as data markers, titles, data labels, or a legend) with a solid color, gradient, picture, or texture. You cannot use shape fill to format lines in a chart (such as gridlines, axes, trendlines, or error bars).
-
On a chart, click the chart element that you want to change, or do the following to select it from a list of chart elements:
-
Click a chart.
This displays the Chart Tools, adding the Design, Layout, and Format tabs. -
On the Format tab, in the Current Selection group, click the arrow next to the Chart Elements box, and then click the chart element that you want to use.
-
-
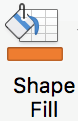
On the Format tab, in the Shape Styles group, click Shape Fill.
-
Do one of the following:
-
To use a different fill color, under Theme Colors or Standard Colors, click the color that you want to use.
Tip: Before you apply a different color, you can quickly preview how that color affects the chart. When you point to colors that you may want to use, the selected chart element will be displayed in that color on the chart.
-
To remove the color from the selected chart element, click No Fill.
-
To use a fill color that is not available under Theme Colors or Standard Colors, click More Fill Colors. In the Colors dialog box, specify the color that you want to use on the Standard or Custom tab, and then click OK.
Custom fill colors that you create are added under Recent Colors so that you can use them again.
-
To fill the shape with a picture, click Picture. In the Insert Picture dialog box, click the picture that you want to use, and then click Insert.
-
To use a gradient effect for the selected fill color, click Gradient, and then under Variations, click the gradient style that you want to use.
For additional gradient styles, click More Gradients, and then in the Fill category, click the gradient options that you want to use.
-
To use a texture fill, click Texture, and then click the texture that you want to use.
-
Tip: If you don't like the change that you made, you can undo it immediately. On the Quick Access Toolbar, click Undo
You can change the color, width, and line style of lines in a chart (such as gridlines, axes, trendlines, or error bars), or you can create custom borders for selected shapes (such as data markers, titles, data labels, or a legend).
-
On a chart, click the chart element that you want to change, or do the following to select it from a list of chart elements:
-
Click a chart.
This displays the Chart Tools, adding the Design, Layout, and Format tabs. -
On the Format tab, in the Current Selection group, click the arrow next to the Chart Elements box, and then click the chart element that you want to use.
-
-
On the Format tab, in the Shape Styles group, click Shape Outline.
-
Do one of the following:
-
To use a different outline color, under Theme Colors or Standard Colors, click the color that you want to use.
-
To remove the outline color from the selected chart element, click No Outline.
Note: If the selected element is a line, the line will no longer be visible on the chart.
-
To use an outline color that is not available under Theme Colors or Standard Colors, click More Outline Colors. In the Colors dialog box, specify the color that you want to use on the Standard or Custom tab, and then click OK.
Custom outline colors that you create are added under Recent Colors so that you can use them again.
-
To change the weight of a line or border, click Weight, and then click the line weight that you want to use.
For additional line style or border style options, click More Lines, and then click the line style or border style options that you want to use.
-
To use a dashed line or border, click Dashes, and then click the dash type that you want to use.
For additional dash-type options, click More Lines, and then click the dash type that you want to use.
-
To add arrows to lines, click Arrows, and then click the arrow style that you want to use. You cannot use arrow styles for borders.
For additional arrow style or border style options, click More Arrows, and then click the arrow setting that you want to use.
-
Tip: If you don't like the change that you made, you can undo it immediately. On the Quick Access Toolbar, click Undo
You can apply visual effects (such as a shadow, glow, or bevel effects) to selected shapes (such as data markers, titles, data labels, or a legend) and lines (such as gridlines, axes, trendlines, or error bars).
-
On a chart, click the chart element that you want to change, or do the following to select it from a list of chart elements:
-
Click a chart.
This displays the Chart Tools, adding the Design, Layout, and Format tabs. -
On the Format tab, in the Current Selection group, click the arrow next to the Chart Elements box, and then click the chart element that you want to use.
-
-
On the Format tab, in the Shape Styles group, click Shape Effects.
-
Click an available effect, and then select the type of effect that you want to use.
Note: Available shape effects depend on the chart element that you selected. Preset, reflection, and bevel effects are not available for all chart elements.
Tip: If you don't like the change that you made, you can undo it immediately. On the Quick Access Toolbar, click Undo
-
Click a chart.
-
On the Format tab, in the chart elements dropdown, select the chart element that you want to use.
-
On the Format tab, in the shape styles gallery, click the arrow to expand and select a shape.
You can fill a selected shape (such as data markers, titles, data labels, or a legend) with a solid color, gradient, picture, or texture. You cannot use shape fill to format lines in a chart (such as gridlines, axes, trendlines, or error bars).
-
Click a chart.
-
On the Format tab, in the chart elements dropdown, select the chart element that you want to use.
-
On the Format tab, click
-
Do one of the following:
-
To use a different fill color, under Theme Colors or Standard Colors, click the color that you want to use.
-
To remove the color from the selected chart element, click No Fill.
-
To use a fill color that is not available under Theme Colors or Standard Colors, click More Fill Colors. In the Colors dialog box, use the available options to pick a color, and then click OK.
-
To fill the shape with a picture, click Picture. In the Insert Picture dialog box, click the picture that you want to use, and then click Insert.
-
To use a gradient effect for the selected fill color, click Gradient, and then click the gradient style that you want to use.
For additional gradient styles, click More Gradients, and then in the Format Chart Area pane, under Fill, click the gradient options that you want to use.
-
To use a texture fill, click Texture, and then click the texture that you want to use.
-
You can change the color, width, and line style of lines in a chart (such as gridlines, axes, trendlines, or error bars), or you can create custom borders for selected shapes (such as data markers, titles, data labels, or a legend).
-
Click a chart.
-
On the Format tab, in the chart elements dropdown, select the chart element that you want to use.
-
On the Format tab, click

-
Do one of the following:
-
To use a different outline color, under Theme Colors or Standard Colors, click the color that you want to use.
-
To remove the outline color from the selected chart element, click No Outline.
Note: If the selected element is a line, the line will no longer be visible on the chart.
-
To use an outline color that is not available under Theme Colors or Standard Colors, click More Outline Colors. In the Colors dialog box, use the available options to pick a color, and then click OK.
-
To change the weight of a line or border, click Weight, and then click the line weight that you want to use.
-
To use a dashed line or border, click Dashes, and then click the dash type that you want to use.
-
To add arrows to lines, click Arrows, and then click the arrow style that you want to use. You cannot use arrow styles for borders.
-
You can apply visual effects (such as a shadow, glow, or bevel effects) to selected shapes (such as data markers, titles, data labels, or a legend) and lines (such as gridlines, axes, trendlines, or error bars).
-
Click a chart.
-
On the Format tab, in the chart elements dropdown, select the chart element that you want to use.
-
On the Format tab, click

-
Click an available effect, and then select the type of effect that you want to use.
Note: Available shape effects depend on the chart element that you selected. Preset, reflection, and bevel effects are not available for all chart elements.


