
A data table is a range of cells that shows how changing one or two variables in your formula will affect the results of those formulas. Data tables provide a shortcut for calculating multiple results in one operation and a way to view and compare the results of all the different variations together on your sheet.
Data tables are part of a suite of commands that are called What-if Analysis tools. When you use data tables, you are doing what-if analysis. What-if analysis changes the values in cells to see how those changes will affect the outcome of formulas on the sheet. For example, you can use a data table to vary the interest rate and term length that are used in a loan to determine possible monthly payment amounts.
There are three kinds of what-if analysis tools in Excel: scenarios, data tables, and Goal Seek. Scenarios and data tables take sets of input values and determine possible results. Goal Seek works differently from scenarios and data tables in that it takes a result and determines possible input values that produce that result. Like scenarios, data tables help you explore a set of possible outcomes. Unlike scenarios, data tables show you all the outcomes in one table on one sheet. Using data tables makes it easy to examine a range of possibilities at a glance. Because you focus on only one or two variables, results are easy to read and share in tabular form.
A data table cannot accommodate more than two variables. If you want to analyze more than two variables, you should instead use scenarios. Although it is limited to only one or two variables (one for the row input cell and one for the column input cell), a data table can include many different variable values. A scenario can have a maximum of 32 different values, but you can create as many scenarios as you want.
Data table basics
You can create one-variable or two-variable data tables, depending on the number of variables and formulas that you want to test. Use a one-variable data table if you want to see how different values of one variable in one or more formulas will change the results of those formulas. For example, you can use a one-variable data table to see how different interest rates affect a monthly mortgage payment by using the PMT function. You enter the variable values in one column or row, and the outcomes are displayed in an adjacent column or row.
For more information, see PMT function.
Cell D2 contains the payment formula, =PMT(B3/12,B4,-B5), which refers to the input cell B3.
A one-variable data table


Use a two-variable data table to see how different values of two variables in one formula will change the results of that formula. For example, you can use a two-variable data table to see how different combinations of interest rates and loan terms will affect a monthly mortgage payment.
Cell C2 contains the payment formula, =PMT(B3/12,B4,-B5), which uses two input cells, B3 and B4.
A two-variable data table


Data tables are recalculated when a sheet is recalculated, even if they have not changed. To speed up calculation of a sheet that contains a data table, you can change the Calculation options to automatically recalculate the sheet but not the data tables.
A one-variable data table has input values that are listed either down a column (column-oriented) or across a row (row-oriented). Formulas that are used in a one-variable data table must refer to only one input cell.
-
Type the list of values that you want to substitute in the input cell either down one column or across one row. Leave several empty rows and columns on either side of the values.
-
Do one of the following:
|
If the data table is |
Do this |
|
Column-oriented (your variable values are in a column) |
Type the formula in the cell one row above and one cell to the right of the column of values. The one-variable data table illustration shown in the Overview section is column-oriented, and the formula is contained in cell D2. Note: If you want to examine the effects of various values on other formulas, type the additional formulas in cells to the right of the first formula. |
|
Row-oriented (your variable values are in a row) |
Type the formula in the cell one column to the left of the first value and one cell below the row of values Note: If you want to examine the effects of various values on other formulas, type the additional formulas in cells below the first formula. |
-
Select the range of cells that contains the formulas and values that you want to substitute. Based on the first illustration in the previous Overview section, this range is C2:D5.
-
In Excel 2016 for Mac: Click Data > What-if Analysis > Data Table.
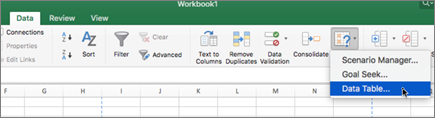
In Excel for Mac 2011: On the Data tab, under Analysis, click What-If, and then click Data Table.
-
Do one of the following:
|
If the data table is |
Do this |
|
Column-oriented |
Type the cell reference for the input cell in the Column input cell box. Using the example shown in the first illustration, the input cell is B3. |
|
Row-oriented |
Type the cell reference for the input cell in the Row input cell box. |
Note: After you create your data table, you might want to change the format of the result cells. In the illustration, the result cells are formatted as currency.
Formulas that are used in a one-variable data table must refer to the same input cell.
-
Do one of the following:
|
If the data table is |
Do this |
|
Column-oriented (your variable values are in a column) |
Type the new formula in a blank cell to the right of an existing formula in the top row of the data table. |
|
Row-oriented (your variable values are in a row) |
Type the new formula in a blank cell below an existing formula in the first column of the data table. |
-
Select the range of cells that contains the data table and the new formula.
-
In Excel 2016 for Mac: Click Data > What-if Analysis > Data Table.
In Excel for Mac 2011: On the Data tab, under Analysis, click What-If, and then click Data Table.
-
Do one of the following:
|
If the data table is |
Do this |
|
Column-oriented |
Type the cell reference for the input cell in the Column input cell box. |
|
Row-oriented |
Type the cell reference for the input cell in the Row input cell box. |
A two-variable data table uses a formula that contains two lists of input values. The formula must refer to two different input cells.
-
In a cell on the sheet, enter the formula that refers to the two input cells. In the following example, in which the formula's starting values are entered in cells B3, B4, and B5, type the formula =PMT(B3/12,B4,-B5) in cell C2.
-
Type one list of input values in the same column, below the formula. In this case, type the different interest rates in cells C3, C4, and C5.
-
Enter the second list in the same row as the formula, to its right. Type the loan terms (in months) in cells D2 and E2.
-
Select the range of cells that contains the formula (C2), both the row and column of values (C3:C5 and D2:E2), and the cells in which you want the calculated values (D3:E5). In this case, select the range C2:E5.
-
In Excel 2016 for Mac: Click Data > What-if Analysis > Data Table.
In Excel for Mac 2011: On the Data tab, under Analysis, click What-If, and then click Data Table.
-
In the Row input cell box, enter the reference to the input cell for the input values in the row. Type B4 in the Row input cell box.
-
In the Column input cell cell box, enter the reference to the input cell for the input values in the column. Type B3 in the Column input cell box.
A two-variable data table can show how different combinations of interest rates and loan terms will affect a monthly mortgage payment. In the following illustration, cell C2 contains the payment formula, =PMT(B3/12,B4,-B5), which uses two input cells, B3 and B4.
Important: When you select this calculation option, data tables are skipped when the rest of the workbook is recalculated. To manually recalculate your data table, select its formulas and then press F9. To use this keyboard shortcut in Mac OS X version 10.3 or later, you must first turn off the Exposé keyboard shortcut for this key. For more information, see Keyboard shortcuts in Excel for Windows.
-
On the Excel menu, click Preferences.
-
In the Formulas and Lists section, click Calculation, and then click Automatically except for data tables.
See Also
Introduction to What-If Analysis
Define and solve a problem by using Solver
Use Goal Seek to find the result that you want from a formula


