
Instant charts using Quick Analysis
Quick Analysis takes a range of data and helps you pick the perfect chart with just a few commands.

-
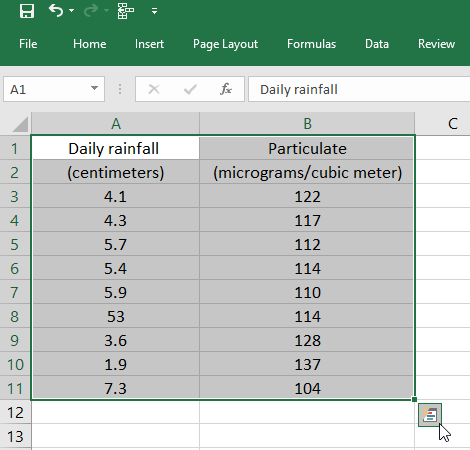
Select a range of cells.
-
Select the Quick Analysis button that appears at the bottom right corner of the selected data.
Or, press Ctrl + Q.
-
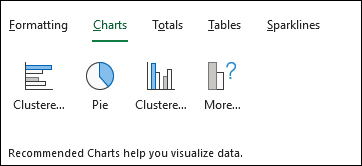
Select Charts.
-
Hover over the chart types to preview a chart, and then select the chart you want.
-
Select More > All Charts to all available see all charts available. Preview and select OK when done to insert the chart.
Need more help?
You can always ask an expert in the Excel Tech Community or get support in Communities.


Need more help?
Want more options?
Explore subscription benefits, browse training courses, learn how to secure your device, and more.


Communities help you ask and answer questions, give feedback, and hear from experts with rich knowledge.


