
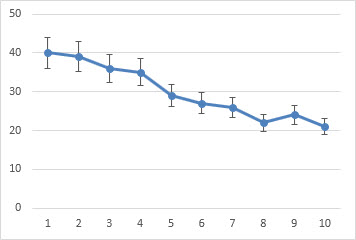
Error bars in charts you create can help you see margins of error and standard deviations at a glance. They can be shown on all data points or data markers in a data series as a standard error amount, a percentage, or a standard deviation. You can set your own values to display the exact error amounts you want. For example, you can show a 10 percent positive and negative error amount in the results of a scientific experiment like this:
You can use error bars in 2-D area, bar, column, line, xy (scatter), and bubble charts. In scatter and bubble charts, you can show error bars for x and y values.
Note: The following procedures apply to Office 2013 and newer versions. Looking for Office 2010 steps?
Add or remove error bars
-
Click anywhere in the chart.
-
Click the Chart Elements button
-
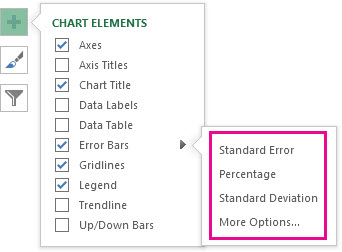
To change the error amount shown, click the arrow next to Error Bars, and then pick an option.
-
Pick a predefined error bar option like Standard Error, Percentage or Standard Deviation.
-
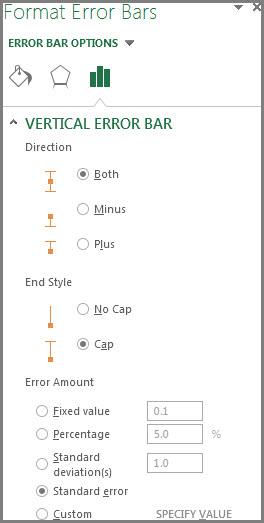
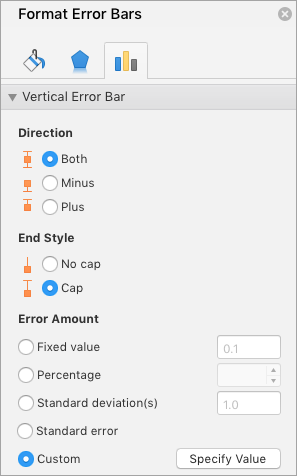
Pick More Options to set your own error bar amounts, and then under Vertical Error Bar or Horizontal Error Bar, choose the options you want. This is also where you can change the direction, end style of the error bars, or create custom error bars.
-

Note: The direction of the error bars depends on the type of chart you’re using. Scatter charts can show both horizontal and vertical error bars. You can remove either of these error bars by selecting them, and then pressing Delete.
Review equations for calculating error amounts
People often ask how Excel calculates error amounts. Excel uses the following equations to calculate the Standard Error and Standard Deviation amounts that are shown on the chart.
|
This option |
Uses this equation |
|---|---|
|
Standard Error |
Where: s = series number i = point number in series s m = number of series for point y in chart n = number of points in each series yis = data value of series s and the ith point ny = total number of data values in all series |
|
Standard Deviation |
Where: s = series number i = point number in series s m = number of series for point y in chart n = number of points in each series yis = data value of series s and the ith point ny = total number of data values in all series M = arithmetic mean |
Add, change, or remove errors bars in a chart in Office 2010
In Excel, you can display error bars that use a standard error amount, a percentage of the value (5%), or a standard deviation.
Standard Error and Standard Deviation use the following equations to calculate the error amounts that are shown on the chart.
|
This option |
Uses this equation |
Where |
|---|---|---|
|
Standard Error |
|
s = series number i = point number in series s m = number of series for point y in chart n = number of points in each series yis = data value of series s and the ith point ny = total number of data values in all series |
|
Standard Deviation |
|
s = series number i = point number in series s m = number of series for point y in chart n = number of points in each series yis = data value of series s and the ith point ny = total number of data values in all series M = arithmetic mean |
-
On 2-D area, bar, column, line, xy (scatter), or bubble chart, do one of the following:
-
To add error bars to all data series in the chart, click the chart area.
-
To add error bars to a selected data point or data series, click the data point or data series that you want, or do the following to select it from a list of chart elements:
-
Click anywhere in the chart.
This displays the Chart Tools, adding the Design, Layout, and Format tabs.
-
On the Format tab, in the Current Selection group, click the arrow next to the Chart Elements box, and then click the chart element that you want.
-
-
-
On the Layout tab, in the Analysis group, click Error Bars.
-
Do one of the following:
-
Click a predefined error bar option, such as Error Bars with Standard Error, Error Bars with Percentage, or Error Bars with Standard Deviation.
-
Click More Error Bar Options, and then under Vertical Error Bars or Horizontal Error Bars, click the display and error amount options that you want to use.
Note: The direction of the error bars depends on the chart type of your chart. For scatter charts, both horizontal and vertical error bars are displayed by default. You can remove either of these error bars by selecting them, and then pressing DELETE.
-

-
On a 2-D area, bar, column, line, xy (scatter), or bubble chart, click the error bars, the data point, or the data series that has the error bars that you want to change, or do the following to select them from a list of chart elements:
-
Click anywhere in the chart.
This displays the Chart Tools, adding the Design, Layout, and Format tabs.
-
On the Format tab, in the Current Selection group, click the arrow next to the Chart Elements box, and then click the chart element that you want.
-
-
On the Layout tab, in the Analysis group, click Error Bars, and then click More Error Bar Options.
-
Under Display, click the error bar direction and end style that you want to use.
-
On a 2-D area, bar, column, line, xy (scatter), or bubble chart, click the error bars, the data point, or the data series that has the error bars that you want to change, or do the following to select them from a list of chart elements:
-
Click anywhere in the chart.
This displays the Chart Tools, adding the Design, Layout, and Format tabs.
-
On the Format tab, in the Current Selection group, click the arrow next to the Chart Elements box, and then click the chart element that you want.
-
-
On the Layout tab, in the Analysis group, click Error Bars, and then click More Error Bar Options.
-
Under Error Amount, do one or more of the following:
-
To use a different method to determine the error amount, click the method that you want to use, and then specify the error amount.
-
To use custom values to determine the error amount, click Custom, and then do the following:
-
Click Specify Value.
-
In the Positive Error Value and Negative Error Value boxes, specify the worksheet range that you want to use as error amount values, or type the values that you want to use, separated by commas. For example, type 0.4, 0.3, 0.8.
Tip: To specify the worksheet range, you can click the Collapse Dialog button

Note: In Microsoft Office Word 2007 or Microsoft Office PowerPoint 2007, the Custom Error Bars dialog box may not show the Collapse Dialog button, and you can only type the error amount values that you want to use.
-
-
-
On a 2-D area, bar, column, line, xy (scatter), or bubble chart, click the error bars, the data point, or the data series that has the error bars that you want to remove, or do the following to select them from a list of chart elements:
-
Click anywhere in the chart.
This displays the Chart Tools, adding the Design, Layout, and Format tabs.
-
On the Format tab, in the Current Selection group, click the arrow next to the Chart Elements box, and then click the chart element that you want.
-
-
Do one of the following:
-
On the Layout tab, in the Analysis group, click Error Bars, and then click None.
-
Press DELETE.
-
Tip: You can remove error bars immediately after you add them to the chart by clicking Undo on the Quick Access Toolbar or by pressing CTRL+Z.
Do any of the following:
Express errors as a percentage, standard deviation, or standard error
-
In the chart, select the data series that you want to add error bars to.
For example, in a line chart, click one of the lines in the chart, and all the data marker of that data series become selected.
-
On the Chart Design tab, click Add Chart Element.

-
Point to Error Bars, and then do one of the following:
|
Click |
To |
|---|---|
|
Standard Error |
Apply the standard error, using the following formula:
s = series number |
|
Percentage |
Apply a percentage of the value for each data point in the data series |
|
Standard Deviation |
Apply a multiple of the standard deviation, using the following formula:
s = series number |


Express errors as custom values
-
In the chart, select the data series that you want to add error bars to.
-
On the Chart Design tab, click Add Chart Element, and then click More Error Bars Options.
-
In the Format Error Bars pane, on the Error Bar Options tab, under Error Amount, click Custom, and then click Specify Value.
-
Under Error amount, click Custom, and then click Specify Value.
-
In the Positive Error Value and Negative Error Value boxes, type the values that you want for each data point, separated by commas (for example, 0.4, 0.3, 0.8), and then click OK.
Note: You can also define error values as a range of cells from the same Excel workbook. To select the range of cells, in the Custom Error Bars dialog box, clear the contents of the Positive Error Value or Negative Error Value box, and then select the range of cells that you want to use.
Add up/down bars
-
In the chart, select the data series that you want to add up/down bars to.
-
On the Chart Design tab, click Add Chart Element, point to Up/Down Bars, and then click Up/down Bars.
Depending on the chart type, some options may not be available.


