
Important: In Excel for Microsoft 365 and Excel 2021, Power View is removed on October 12, 2021. As an alternative, you can use the interactive visual experience provided by Power BI Desktop, which you can download for free. You can also easily Import Excel workbooks into Power BI Desktop.
This article can help you understand how you can use Power View, a browser-based Silverlight application launched from SharePoint Server, to interactively explore data and create dynamic visualizations from Analysis Services Multidimensional models.
When using Power View to visualize multidimensional models, it is important to keep in mind you are working with a tabular model type representation of a multidimensional model. Tabular models have objects such as tables and columns, and just like with multidimensional models, measures and KPIs.
When you or an administrator creates a shared data source connection in SharePoint, a cube name or perspective is specified in the connection string. Only one cube or perspective can be specified. The cube or perspective specified in the shared data source connection is exposed as a model in the Power View Field List. Objects in the model, are exposed as fields you can use in table visualizations in a view. There are, however, some differences in how certain multidimensional objects appear in Power View. Just like with tabular models, the Field List displays all of the objects you can use in a view.
Multidimensional models have dimensions. In this example, the Field List contains objects in the Product dimension. Product appears as a table in the Adventure Works model (cube). A table, or dimension, has other objects too.
Dimension objects

-
A. Dimensions appear as tables and can be expanded to show other objects in the table (dimension). The Adventure Works cube has many tables, Account through Source Currency.
-
B. Display folders further divide and classify how associated objects appear in client tools. Display folders can appear in the Field List below dimension tables and measure group tables.
-
C. Dimension attributes appear as columns in a table. A single column (attribute) can appear both in a table, and again in a hierarchy, unless explicitly hidden.
-
D. User and parent-child hierarchies are included in tables (dimensions). Hierarchies can be expanded to show columns (levels) in them. When you select a level, all levels above are also automatically selected. You can unselect higher levels to remove them from the visualization. This can be useful when certain fields are exposed only in a hierarchy.
-
E. Objects with this icon indicate this object is a key.
Multidimensional models also have measure groups, also known as measure dimensions, which contain measures you can use to aggregate data in your analysis.
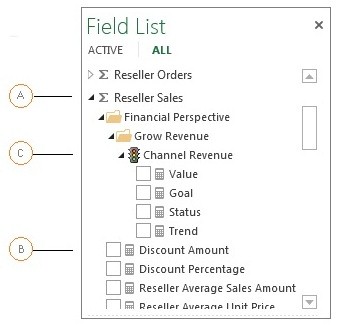
Measure groups objects
-
A. Measure Groups appear as tables; however, unlike tables from a dimension, a table from a measure group is identified by a sigma icon.
-
B. Measures appear in measure group tables and are identified with a calculator icon. If your cube has only one measure, it will be included in an associated measure group if there is one, or in a single table named Measures.
-
C. KPIs are included in associated measure group tables, and are identified with a stoplight icon. For example, if in the Adventure Works model you expand Reseller Sales > Financial Perspective > Grow Revenue, you will see the Channel Revenue KPI and its four measures; Value, Goal, Status, and Trend.
Try it for yourself! If your administrator has the necessary prerequisites installed, you can follow the steps in Explore the Adventure Works Multidimensional Model by using Power View to create a sample report with a multidimensional data source.


