
Track, analyze, and visualize your cash flow, profit margin, revenue growth, market share and other key performance indicators with Microsoft Excel and PowerPointtemplates.
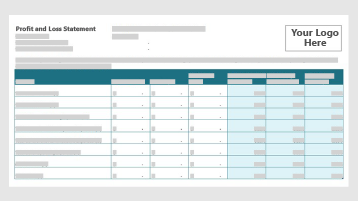
Track and analyze business data in Excel
Use these templates to get started:
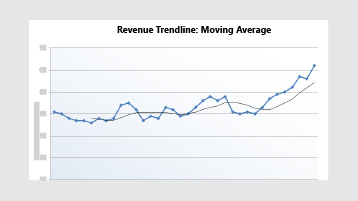
Then use charts, PivotTables and sparklines to analyze and visualize your data.
Need a little help? Learn how to:
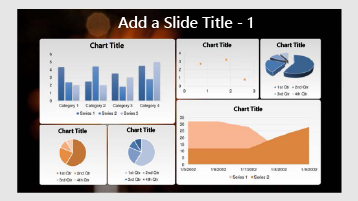
Visualize your data with PowerPoint
Want to share the data, trends, and opportunities with your team? Use these PowerPoint templates to show your data in a visual way:
Related resources
Related articles
Why data visualization is a must for understanding business intelligence
5 ways your small business can benefit from data analysis tools
Buy Microsoft 365
Get help setting up


