Related topics
×
Charts
Sign in with Microsoft
Sign in or create an account.
Hello,
Select a different account.
You have multiple accounts
Choose the account you want to sign in with.
Charts

Add or remove titles in a chart

To make a chart easier to understand, you can add chart title and axis titles, to any type of chart. Axis titles are typically available for all axes that can be displayed in a chart, including depth (series) axes in 3-D charts. Some chart types (such as radar charts) have axes, but they cannot display axis titles. You can’t add axis titles to charts that don’t have axes (like pie or doughnut charts).

Your browser does not support video. Install Microsoft Silverlight, Adobe Flash Player, or Internet Explorer 9.

Add a chart title

  1. In the chart, select the "Chart Title" box and type in a title.

  2. Select the + sign to the top-right of the chart.

  3. Select the arrow next to Chart Title.

  4. Select Centered Overlay to lay the title over the chart, or More Options for additional choices.

  5. Right-click the chart title to format it with options like Fill or Outline.

Remove a chart title

  1. Click on the chart.

  2. Select the + sign to the top-right of the chart.

  3. Uncheck the checkbox next to Chart Title.

  1. Click anywhere in the chart to which you want to add a title.

    This displays the Chart Tools, adding the Design, Layout, and Format tabs.

  2. On the Layout tab, in the Labels group, click Chart Title.

  3. Click Centered Overlay Title or Above Chart.

  4. In the Chart Title text box that appears in the chart, type the text that you want.

    To start a new line, press ENTER. To insert a line break, click to place the cursor where you want to break the line, and then press ENTER.

  5. To format the text in the title box, do the following:

    1. Click in the title box, and then select the text that you want to format.

    2. On the Mini toolbar, click the formatting options that you want.

      You can also use the formatting buttons on the ribbon (Home tab, Font group). To format the whole title, you can right-click it, click Format Chart Title, and then select the formatting options that you want.

  • The size of the title box adjusts to the size of the text. You cannot resize the title box, and the text may become truncated if it does not fit in the maximum size.

  • You can only add one title to a chart. If you want to use a second title or a sub title, you can draw a text box on the chart, and move it to the location that you want (Chart Tools, Layout tab, Insert group, Text Box).

  • You can manually move the title to another location by dragging the title box to the location that you want.

  1. Click anywhere in the chart to which you want to add axis titles.

    This displays the Chart Tools, adding the Design, Layout, and Format tabs.

  2. On the Layout tab, in the Labels group, click Axis Titles.

  3. Do any of the following:

    • To add a title to a primary horizontal (category) axis, click Primary Horizontal Axis Title, and then click the option that you want.

      If the chart has a secondary horizontal axis, you can also click Secondary Horizontal Axis Title.

    • To add a title to primary vertical (value) axis, click Primary Vertical Axis Title or Secondary Vertical Axis Title, and then click the option that you want.

      If the chart has a secondary vertical axis, you can also click Secondary Vertical Axis Title.

    • To add a title to a depth (series) axis, click Depth Axis Title, and then click the option that you want.

      This option is only available when the selected chart is a true 3-D chart, such as a 3-D column chart.

  4. In the Axis Title text box that appears in the chart, type the text that you want.

    To start a new line, press ENTER. To insert a line break, click to place the cursor where you want to break the line, and then press ENTER.

  5. To format the text in the title box, do the following:

    1. Click in the title box, and then select the text that you want to format.

    2. On the Mini toolbar, click the formatting options that you want.

      You can also use the formatting buttons on the ribbon (Home tab, Font group. To format the whole title, you can right-click it, click Format Axis Title, and then select the formatting options that you want.

      Notes: 

      • If you switch to another chart type that does not support axis titles (such as a pie chart), the axis titles will no longer be displayed. The titles will be displayed again when you switch back to a chart type that does support axis titles.

      • Axis titles that are displayed for secondary axes will be lost when you switch to a chart type that does not display secondary axes.

  1. On a chart, click the chart or axis title that you want to link to a worksheet cell.

  2. On the worksheet, click in the formula bar, and then type an equal sign (=).

  3. Select the worksheet cell that contains the data or text that you want to display in your chart.

    You can also type the reference to the worksheet cell in the formula bar. Include an equal sign, the sheet name, followed by an exclamation point; for example, =Sheet1!F2

  4. Press ENTER.

  1. Click anywhere in the chart.

    This displays the Chart Tools, adding the Design, Layout, and Format tabs.

  2. Do one of the following:

    • To remove a chart title, on the Layout tab, in the Labels group, click Chart Title, and then click None.

    • To remove an axis title, on the Layout tab, in the Labels group, click Axis Title, click the type of axis title that you want to remove, and then click None.

    • To quickly remove a chart or axis title, click the title, and then press DELETE. You can also right-click the chart or axis title, and then click Delete.

    • To remove chart or axis titles immediately after you add them, you can click Undo on the Quick Access Toolbar, or you can press CTRL+Z.

You can add a title to your chart.

Chart title

Axis titles

  1. This step applies to Word 2016 for Mac only: On the View menu, click Print Layout.

  2. Click the chart, and then click the Chart Design tab.

  3. Click Add Chart Element > Chart Title, and then click the title option that you want.

  4. Type the title in the Chart Title box.

    To format the title, select the text in the title box, and then on the Home tab, under Font, select the formatting that you want.

You can add a title to each axis in a chart. Axis titles are typically available for all axes that can be displayed in a chart, including depth (series) axes in 3-D charts.

Some chart types (such as radar charts) have axes, but they cannot display axis titles. Chart types that do not have axes (such as pie and doughnut charts) cannot display axis titles either.

Chart title

Axis titles

  1. This step applies to Word 2016 for Mac only: On the View menu, click Print Layout.

  2. Click the chart, and then click the Chart Design tab.

  3. Click Add Chart Element > Axis Titles, and then choose an axis title option.

  4. Type the text in the Axis Title box.

    To format the title, select the text in the title box, and then on the Home tab, under Font, select the formatting that you want.

You can add a title to your chart.

Chart title

Axis titles

Follow these steps to add a title to your chart in Excel or Mac 2011, Word for Mac 2011, and PowerPoint for Mac 2011.

  1. This step applies to Word for Mac 2011 only: On the View menu, click Print Layout.

  2. Click the chart, and then click the Chart Layout tab.

  3. Under Labels, click Chart Title, and then click the one that you want.

  4. Select the text in the Chart Title box, and then type a chart title.

    To format the title, select the text in the title box, and then on the Home tab, under Font, select the formatting that you want.

You can add a title to each axis in a chart. Axis titles are typically available for all axes that can be displayed in a chart, including depth (series) axes in 3-D charts.

Some chart types (such as radar charts) have axes, but they cannot display axis titles. Chart types that do not have axes (such as pie and doughnut charts) cannot display axis titles either.

Chart title

Axis titles

  1. This step applies to Word for Mac 2011 only: On the View menu, click Print Layout.

  2. Click the chart, and then click the Chart Layout tab.

  3. Under Labels, click Axis Titles, point to the axis that you want to add titles to, and then click the option that you want.

  4. Select the text in the Axis Title box, and then type an axis title.

    To format the title, select the text in the title box, and then on the Home tab, under Font, select the formatting that you want.

Your browser does not support video. Install Microsoft Silverlight, Adobe Flash Player, or Internet Explorer 9.

Add or edit a chart title

You can add or edit a chart title, customize its look, and include it on the chart.

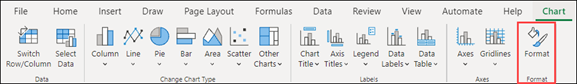
  1. Click anywhere in the chart to show the Chart tab on the ribbon.

  2. Click Format to open the chart formatting options.

    Excel for the web Chart Format

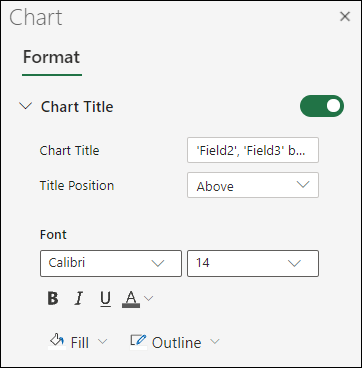
  3. In the Chart pane, expand the Chart Title section.
    Chart Title Options for Excel on the web

  4. Add or edit the Chart Title to meet your needs.

  5. Use the switch to hide the title if you don't want your chart to show a title.

Need more help?

You can always ask an expert in the Excel Tech Community or get support in Communities.

See Also

Change the placement of titles in a chart

Get Microsoft chart templates

Need more help?

Want more options?

Explore subscription benefits, browse training courses, learn how to secure your device, and more.

Communities help you ask and answer questions, give feedback, and hear from experts with rich knowledge.

Was this information helpful?

What affected your experience?
By pressing submit, your feedback will be used to improve Microsoft products and services. Your IT admin will be able to collect this data. Privacy Statement.

Thank you for your feedback!

×