
In Visio Professional, you can color shapes depending on their data values. This is also known as the color by value data graphic. The coloring can be applied after you import data to shapes in your drawing.
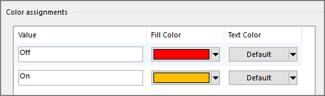
For example, in the illustration below, all of the computer shapes that have the value “Off” are colored red. The computers that are “On” have the color of green.
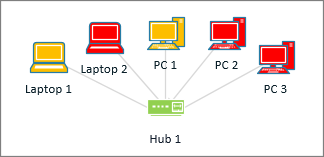
Note: Although Visio refers to “color by value” as a data "graphic," this option doesn’t show additional “graphics” or symbols next to the shapes. Instead, it simply fills the shape with a color according to its data.
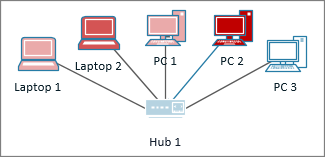
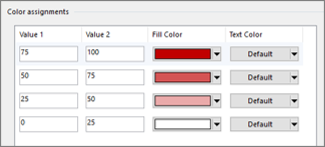
You can also apply different shades of color depending on a range of values. In the example below, the computers are colored by value. They are colored depending on how much their CPU is processing. Computers with high processing are dark red. Those with lower processing are colored with a lighter red, or even white.
Setting up Color by Value
-
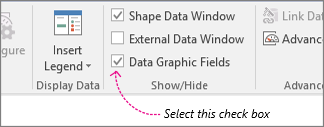
Make sure the Data Graphic Fields pane is open on the right. If it isn’t open, on the Data tab, click to select the Data Graphic Fields check box.
-
Do one of the following:
-
If you want to change all shapes on the page, click an empty space on the diagram to deselect any shapes that may be selected.
-
If you want to change only select shapes on the page, click one or more shapes to select them.
-
-
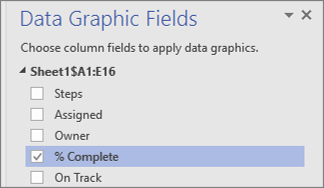
In the Data Graphic Fields pane, identify which field of data you want to apply coloring to.
-
In the same pane, make sure the field you want to change has a check mark, and make sure to select it so that it is highlighted in blue:
-
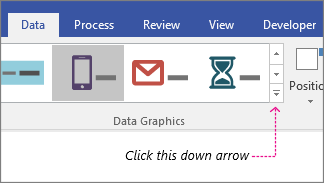
On the Data tab, click the down arrow at the bottom of the Data Graphic gallery.
-
Under Color by Value, select one of the following:
-
This option

-
This option

-
Configuring the coloring
After applying a color, you may need to configure the colors to represent your data properly.
-
Do steps 1-4 above.
-
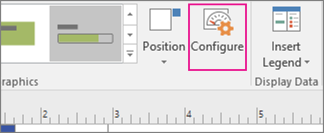
On the Data tab, click Configure.
-
Do one of the following:
-
If you chose this option:
-
If you chose this option:
-
-
If you want to correct any of the values, you can do so in the Value columns.
-
If you want to add any additional coloring assignments, click Insert on the right, type new values, and choose colors for those value.
-
If you want to remove any coloring assignments, click Delete on the right.


