
This article explains how to use a type of function in Access called an aggregate function to sum the data in a query result set. This article also briefly explains how to use other aggregate functions, such as COUNT and AVG to count or average the values in a result set. In addition, this article explains how to use the Total Row, a feature in Access that you use to sum data without having to alter the design of your queries.
What do you want to do?
Understand ways to sum data
You can sum a column of numbers in a query by using a type of function called an aggregate function. Aggregate functions perform a calculation on a column of data and return a single value. Access provides a variety of aggregate functions, including Sum, Count, Avg (for computing averages), Min and Max. You sum data by adding the Sum function to your query, you count data by using the Count function, and so on.
In addition, Access provides several ways to add Sum and other aggregate functions to a query. You can:
-
Open your query in Datasheet view and add a Total row. The Total Row, a feature in Access, allows you to use an aggregate function in one or more columns of a query result set without having to change the design of your query.
-
Create a totals query. A totals query calculates subtotals across groups of records; a Total row calculates grand totals for one or more columns (fields) of data. For example, if you want to subtotal all sales by city or by quarter, you use a totals query to group your records by the desired category and you then sum the sales figures.
-
Create a crosstab query. A crosstab query is a special type of query that displays its results in a grid that resembles an Excel worksheet. Crosstab queries summarize your values and then group them by two sets of facts — one set down the side (row headings), and the other across the top (column headings). For example, you can use a crosstab query to display sales totals for each city for the past three years, as the following table shows:
|
City |
2003 |
2004 |
2005 |
|---|---|---|---|
|
Paris |
254,556 |
372,455 |
467,892 |
|
Sydney |
478,021 |
372,987 |
276,399 |
|
Jakarta |
572,997 |
684,374 |
792,571 |
|
... |
... |
... |
... |
Note: The how-to sections in this document emphasize using the Sum function, but remember that you can use other aggregate functions in your Total rows and queries. For more information about using the other aggregate functions, see the section Aggregate function reference later in this article.
For more information about ways to use the other aggregate functions, see the article Display column totals in a datasheet.
The steps in the following sections explain how to add a Total row, use a totals query to sum data across groups, and how to use a crosstab query that subtotals data across groups and time intervals. As you proceed, remember that many of the aggregate functions work only on data in fields set to a specific data type. For example, the SUM function works only with fields set to the Number, Decimal, or Currency data types. For more information about the data types that each function requires, see the section Aggregate function reference, later in this article.
For general information about data types, see the article Modify or change the data type set for a field.
Prepare some sample data
The how-to sections in this article provide tables of sample data. The how-to steps use the sample tables in order to help you understand how the aggregate functions work. If you prefer, you can optionally add the sample tables into a new or existing database.
Access provides several ways to add these sample tables to a database. You can enter the data manually, you can copy each table into a spreadsheet program such as Excel and then import the worksheets into Access, or you can paste the data into a text editor such as Notepad and import the data from the resulting text files.
The steps in this section explain how to enter data manually in a blank datasheet, and how to copy the sample tables to a spreadsheet program, and then import those tables into Access. For more information about creating and importing text data, see the article Import or link to data in a text file.
The how-to steps in this article use the following tables. Use these tables to create your sample data:
The Categories table:
|
Category |
|---|
|
Dolls |
|
Games and Puzzles |
|
Art and Framing |
|
Video Games |
|
DVDs and Movies |
|
Models and Hobbies |
|
Sports |
The Products table:
|
Product Name |
Price |
Category |
|---|---|---|
|
Programmer action figure |
$12.95 |
Dolls |
|
Fun with C# (A board game for the whole family) |
$15.85 |
Games and Puzzles |
|
Relational Database Diagram |
$22.50 |
Art and Framing |
|
The Magical Computer Chip (500 Pieces) |
$32.65 |
Games and Puzzles |
|
Access! The Game! |
$22.95 |
Games and Puzzles |
|
Computer Geeks and Mythical Creatures |
$78.50 |
Video Games |
|
Exercise for Computer Geeks! The DVD! |
$14.88 |
DVDs and Movies |
|
Ultimate Flying Pizza |
$36.75 |
Sports |
|
External 5.25-inch Floppy Diskette Drive (1/4 Scale) |
$65.00 |
Models and Hobbies |
|
Bureaucrat non-action figure |
$78.88 |
Dolls |
|
Gloom |
$53.33 |
Video Games |
|
Build Your Own Keyboard |
$77.95 |
Models and Hobbies |
The Orders table:
|
Order Date |
Ship Date |
Ship City |
Shipping Fee |
|---|---|---|---|
|
11/14/2005 |
11/15/2005 |
Jakarta |
$55.00 |
|
11/14/2005 |
11/15/2005 |
Sydney |
$76.00 |
|
11/16/2005 |
11/17/2005 |
Sydney |
$87.00 |
|
11/17/2005 |
11/18/2005 |
Jakarta |
$43.00 |
|
11/17/2005 |
11/18/2005 |
Paris |
$105.00 |
|
11/17/2005 |
11/18/2005 |
Stuttgart |
$112.00 |
|
11/18/2005 |
11/19/2005 |
Vienna |
$215.00 |
|
11/19/2005 |
11/20/2005 |
Miami |
$525.00 |
|
11/20/2005 |
11/21/2005 |
Vienna |
$198.00 |
|
11/20/2005 |
11/21/2005 |
Paris |
$187.00 |
|
11/21/2005 |
11/22/2005 |
Sydney |
$81.00 |
|
11/23/2005 |
11/24/2005 |
Jakarta |
$92.00 |
The Order Details table:
|
Order ID |
Product Name |
Product ID |
Unit Price |
Quantity |
Discount |
|---|---|---|---|---|---|
|
1 |
Build Your Own Keyboard |
12 |
$77.95 |
9 |
5% |
|
1 |
Bureaucrat non-action figure |
2 |
$78.88 |
4 |
7.5% |
|
2 |
Exercise for Computer Geeks! The DVD! |
7 |
$14.88 |
6 |
4% |
|
2 |
The Magical Computer Chip |
4 |
$32.65 |
8 |
0 |
|
2 |
Computer Geeks and Mythical Creatures |
6 |
$78.50 |
4 |
0 |
|
3 |
Access! The Game! |
5 |
$22.95 |
5 |
15% |
|
4 |
Programmer Action Figure |
1 |
$12.95 |
2 |
6% |
|
4 |
Ultimate Flying Pizza |
8 |
$36.75 |
8 |
4% |
|
5 |
External 5.25-inch Floppy Diskette Drive (1/4 Scale) |
9 |
$65.00 |
4 |
10% |
|
6 |
Relational Database Diagram |
3 |
$22.50 |
12 |
6.5% |
|
7 |
Gloom |
11 |
$53.33 |
6 |
8% |
|
7 |
Relational Database Diagram |
3 |
$22.50 |
4 |
9% |
Note: Remember that in a typical database an order details table will contain only a Product ID field, not a Product Name field. The sample table uses a Product Name field to make the data easier to read.
Enter the sample data manually
-
On the Create tab, in the Tables group, click Table.
Access adds a new, blank table to your database.
Note: You do not need to follow this step if you open a new, blank database, but you will need to follow it whenever you need to add a table to the database.
-
Double-click the first cell in the header row and enter the name of the field in the sample table.
By default, Access denotes blank fields in the header row with the text Add New Field, like so:
-
Use the arrow keys to move to the next blank header cell , and type the second field name (you can also press TAB or double-click the new cell). Repeat this step until you enter all field names.
-
Enter the data in the sample table.
As you enter the data, Access infers a data type for each field. If you are new to relational databases, you should set a specific data type, such as Number, Text, or Date/Time, for each of the fields in your tables. Setting the data type helps ensure accurate data entry and also helps prevent mistakes, such as using a telephone number in a calculation. For these sample tables, you should let Access infer the data type.
-
When you finish entering the data, click Save.
Keyboard shortcut Press CTRL+S.
The Save As dialog box appears.
-
In the Table Name box, enter the name of the sample table, and then click OK.
You use the name of each sample table because the queries in the how-to sections use those names.
-
Repeat these steps until you create each of the sample tables listed at the beginning of this section.
If you do not want to enter the data manually, follow the next steps to copy the data to a spreadsheet file, and then import the data from the spreadsheet file into Access.
Create the sample worksheets
-
Start your spreadsheet program and create a new, blank file. If you use Excel, it creates a new, blank workbook by default.
-
Copy the first sample table provided above and paste it into the first worksheet, starting at the first cell.
-
Using the technique provided by your spreadsheet program, rename the worksheet. Give the worksheet the same name as the sample table. For example, if the sample table is named Categories, give your worksheet the same name.
-
Repeat steps 2 and 3, copying each sample table to a blank worksheet and renaming the worksheet.
Note: You might need to add worksheets to your spreadsheet file. For information on doing that task, see the help for your spreadsheet program.
-
Save the workbook to a convenient location on your computer or your network, and go to the next set of steps.
Create database tables from the worksheets
-
On the External Data tab, in the Import & Link group, click New Data Source > From File > Excel.
The Get External Data - Excel Spreadsheet dialog box appears.
-
Click Browse, open the spreadsheet file that you created in the previous steps, and then click OK.
The Import Spreadsheet Wizard starts.
-
By default, the wizard selects the first worksheet in the workbook (the Customers worksheet, if you followed the steps in the previous section), and data from the worksheet appears in the lower section of the wizard page. Click Next.
-
On the next page of the wizard, click First row contains column headings, and then click Next.
-
Optionally, on the next page, use the text boxes and lists under Field Options to change field names and data types or to omit fields from the import operation. Otherwise, click Next.
-
Leave the Let Access add primary key option selected, and click Next.
-
By default, Access applies the name of the worksheet to your new table. Accept the name or enter another name, and then click Finish.
-
Repeats steps 1 through 7 until you have created a table from each worksheet in the workbook.
Rename the primary key fields
Note: When you imported the worksheets, Access automatically added a primary key column to each table and, by default, Access named that column "ID" and set it to the AutoNumber data type. The steps in this explain how to rename each primary key field. Doing so helps to clearly identify all the fields in a query.
-
In the Navigation Pane, right-click each of the tables that you created in the previous steps and click Design View.
-
For each table, locate the primary key field. By default, Access names each field ID.
-
In the Field Name column for each primary key field, add the name of the table.
For example, you would rename the ID field for the Categories table to "Category ID" and the field for the Orders table to "Order ID." For the Order Details table, rename the field to "Detail ID." For the Products table, rename the field to "Product ID."
-
Save your changes.
Whenever the sample tables appear in this article, they include the primary key field, and the field is renamed as described by using the preceding steps.
Sum data by using a Total row
You can add a Total row to a query by opening your query in Datasheet view, adding the row, and then selecting the aggregate function that you want to use, such as Sum, Min, Max, or Avg. The steps in this section explain how to create a basic select query and add a Total row. You do not need to use the sample tables described in the previous section.
Create a basic select query
-
On the Create tab, in the Queries group, click Query Design.
-
Double-click the table or tables that you want to use in your query.
The selected table or tables appear as windows in the upper section of the query designer.
-
Double-click the table fields that you want to use in your query.
You can include fields that contain descriptive data, such as names and descriptions, but you must include a field that contains numeric or currency data.
Each field appears in a cell in the design grid.
-
Click Run

The query result set appears in Datasheet view.
-
Optionally, switch to Design view and adjust your query. To do so, right-click the document tab for the query and click Design View. You can then adjust the query, as needed, by adding or removing table fields. To remove a field, select the column in the design grid and press DELETE.
-
Save your query.
Add a Total row
-
Make sure that your query is open in Datasheet view. To do so, right-click the document tab for the query and click Datasheet View.
-or-
In the Navigation Pane, double-click the query. This runs the query and loads the results into a datasheet.
-
On the Home tab, in the Records group, click Totals.
A new Total row appears in your datasheet.
-
In the Total row, click the cell in the field that you want to sum, and then select Sum from the list.
Hide a Total row
-
On the Home tab, in the Records group, click Totals.
For more information about using a Total row, see the article Display column totals in a datasheet.
Calculate grand totals by using a query
A grand total is the sum of all the values in a column. You can calculate several types of grand totals, including:
-
A simple grand total that sums the values in a single column. For example, you can calculate total shipping costs.
-
A calculated grand total that sums the values in more than one column. For example, you can calculate total sales by multiplying the cost of several items by the number of item ordered, and then totaling the resulting values.
-
A grand total that excludes some records. For example, you can calculate the total sales only for last Friday.
The steps in the following sections explain how to create each type of grand total. The steps use the Orders and Order Details tables.
The Orders table
|
Order ID |
Order Date |
Ship Date |
Ship City |
Shipping Fee |
|---|---|---|---|---|
|
1 |
11/14/2005 |
11/15/2005 |
Jakarta |
$55.00 |
|
2 |
11/14/2005 |
11/15/2005 |
Sydney |
$76.00 |
|
3 |
11/16/2005 |
11/17/2005 |
Sydney |
$87.00 |
|
4 |
11/17/2005 |
11/18/2005 |
Jakarta |
$43.00 |
|
5 |
11/17/2005 |
11/18/2005 |
Paris |
$105.00 |
|
6 |
11/17/2005 |
11/18/2005 |
Stuttgart |
$112.00 |
|
7 |
11/18/2005 |
11/19/2005 |
Vienna |
$215.00 |
|
8 |
11/19/2005 |
11/20/2005 |
Miami |
$525.00 |
|
9 |
11/20/2005 |
11/21/2005 |
Vienna |
$198.00 |
|
10 |
11/20/2005 |
11/21/2005 |
Paris |
$187.00 |
|
11 |
11/21/2005 |
11/22/2005 |
Sydney |
$81.00 |
|
12 |
11/23/2005 |
11/24/2005 |
Jakarta |
$92.00 |
The Order Details table
|
Detail ID |
Order ID |
Product Name |
Product ID |
Unit Price |
Quantity |
Discount |
|---|---|---|---|---|---|---|
|
1 |
1 |
Build Your Own Keyboard |
12 |
$77.95 |
9 |
0.05 |
|
2 |
1 |
Bureaucrat non-action figure |
2 |
$78.88 |
4 |
0.075 |
|
3 |
2 |
Exercise for Computer Geeks! The DVD! |
7 |
$14.88 |
6 |
0.04 |
|
4 |
2 |
The Magical Computer Chip |
4 |
$32.65 |
8 |
0.00 |
|
5 |
2 |
Computer Geeks and Mythical Creatures |
6 |
$78.50 |
4 |
0.00 |
|
6 |
3 |
Access! The Game! |
5 |
$22.95 |
5 |
0.15 |
|
7 |
4 |
Programmer Action Figure |
1 |
$12.95 |
2 |
0.06 |
|
8 |
4 |
Ultimate Flying Pizza |
8 |
$36.75 |
8 |
0.04 |
|
9 |
5 |
External 5.25-inch Floppy Diskette Drive (1/4 Scale) |
9 |
$65.00 |
4 |
0.10 |
|
10 |
6 |
Relational Database Diagram |
3 |
$22.50 |
12 |
0.065 |
|
11 |
7 |
Gloom |
11 |
$53.33 |
6 |
0.08 |
|
12 |
7 |
Relational Database Diagram |
3 |
$22.50 |
4 |
0.09 |
Calculate a simple grand total
-
On the Create tab, in the Queries group, click Query Design.
-
Double-click the table that you want to use in your query.
If you use the sample data, double-click the Orders table.
The table appears in a window in the upper section of the query designer.
-
Double-click the field that you want to sum. Make sure that the field is set to either the Number or Currency data type. If you try to sum values in non-numeric fields, such as a Text field, Access displays the Data type mismatch in criteria expression error message when you try to run the query.
If you use the sample data, double-click the Shipping Fee column.
You can add additional numeric fields to the grid if you want to calculate grand totals for those fields. A totals query can calculate grand totals for more than one column.
-
On the Query Design tab, in the Show/Hide group, click Totals.

The Total row appears in the design grid and Group By appears in the cell in the Shipping Fee column.
-
Change the value in the cell in the Total row to Sum.
-
Click Run
Tip: Note that Access appends "SumOf" to the beginning of the name of the field that you sum. To change the column heading to something more meaningful, such as Total Shipping, switch back to Design view, and click in the Field row of the Shipping Fee column in the design grid. Place the cursor next to Shipping Fee and type the words Total Shipping, followed by a colon, like so: Total Shipping: Shipping Fee.
-
Optionally, save the query and close it.
Calculate a grand total that excludes some records
-
On the Create tab, in the Queries group, click Query Design.
-
Double-click the Order table and Order Details table.
-
Add the Order Date field from the Orders table to the first column in the query design grid.
-
In the Criteria row of the first column, type Date() -1. That expression excludes the current day's records from the calculated total.
-
Next, create the column that calculates the sales amount for each transaction. Type the following expression in the Field row of the second column in the grid:
Total Sales Value: (1-[Order Details].[Discount]/100)*([Order Details].[Unit Price]*[Order Details].[Quantity])
Make sure your expression references fields set to the Number or Currency data types. If your expression refers to fields set to other data types, Access displays the message Data type mismatch in criteria expression when you try to run the query.
-
On the Query Design tab, in the Show/Hide group, click Totals.
The Total row appears in the design grid and Group By appears in the first and second columns.
-
In the second column, change the value in the cell of the Total row to Sum. The Sum function adds the individual sales figures.
-
Click Run
-
Save the query as Daily Sales.
Note: The next time that you open the query in Design view, you might notice a slight change in the values specified in the Field and Total rows of the Total Sales Value column. The expression appears enclosed inside the Sum function, and the Total row displays Expression instead of Sum.
For example, if you use the sample data and create the query (as shown in the previous steps), you see:
Total Sales Value: Sum((1-[Order Details].Discount/100)*([Order Details].Unitprice*[Order Details].Quantity))
Calculate group totals by using a totals query
The steps in this section explain how to create a totals query that calculates subtotals across groups of data. As you proceed, remember that by default, a totals query can include only the field or fields that contain your group data, such as a "categories" field, and the field that contains the data that you want to sum, such as a "sales" field. Totals queries cannot include other fields that describe the items in a category. If you want to see that descriptive data, you can create a second select query that combines the fields in your totals query with the additional data fields.
The steps in this section explain how to create a totals and select queries needed to identify the total sales for each product. The steps assume the use of these sample tables:
The Products table
|
Product ID |
Product Name |
Price |
Category |
|---|---|---|---|
|
1 |
Programmer action figure |
$12.95 |
Dolls |
|
2 |
Fun with C# (A board game for the whole family) |
$15.85 |
Games and Puzzles |
|
3 |
Relational Database Diagram |
$22.50 |
Art and Framing |
|
4 |
The Magical Computer Chip (500 Pieces) |
$32.65 |
Art and Framing |
|
5 |
Access! The Game! |
$22.95 |
Games and Puzzles |
|
6 |
Computer Geeks and Mythical Creatures |
$78.50 |
Video Games |
|
7 |
Exercise for Computer Geeks! The DVD! |
$14.88 |
DVDs and Movies |
|
8 |
Ultimate Flying Pizza |
$36.75 |
Sports |
|
9 |
External 5.25-inch Floppy Diskette Drive (1/4 Scale) |
$65.00 |
Models and Hobby |
|
10 |
Bureaucrat non-action figure |
$78.88 |
Dolls |
|
11 |
Gloom |
$53.33 |
Video Games |
|
12 |
Build Your Own Keyboard |
$77.95 |
Models and Hobby |
The Order Details table
|
Detail ID |
Order ID |
Product Name |
Product ID |
Unit Price |
Quantity |
Discount |
|---|---|---|---|---|---|---|
|
1 |
1 |
Build Your Own Keyboard |
12 |
$77.95 |
9 |
5% |
|
2 |
1 |
Bureaucrat non-action figure |
2 |
$78.88 |
4 |
7.5% |
|
3 |
2 |
Exercise for Computer Geeks! The DVD! |
7 |
$14.88 |
6 |
4% |
|
4 |
2 |
The Magical Computer Chip |
4 |
$32.65 |
8 |
0 |
|
5 |
2 |
Computer Geeks and Mythical Creatures |
6 |
$78.50 |
4 |
0 |
|
6 |
3 |
Access! The Game! |
5 |
$22.95 |
5 |
15% |
|
7 |
4 |
Programmer Action Figure |
1 |
$12.95 |
2 |
6% |
|
8 |
4 |
Ultimate Flying Pizza |
8 |
$36.75 |
8 |
4% |
|
9 |
5 |
External 5.25-inch Floppy Diskette Drive (1/4 Scale) |
9 |
$65.00 |
4 |
10% |
|
10 |
6 |
Relational Database Diagram |
3 |
$22.50 |
12 |
6.5% |
|
11 |
7 |
Gloom |
11 |
$53.33 |
6 |
8% |
|
12 |
7 |
Relational Database Diagram |
3 |
$22.50 |
4 |
9% |
The following steps assume a one-to-many relationship between the Product ID fields in the Orders table and Order Details table, with the Orders table on the "one" side of the relationship.
Create the totals query
-
On the Create tab, in the Queries group, click Query Design.
-
Select the tables that you want to work with, and then click Add.
Each table appears as a window in the upper section of the query designer.
If you use the sample tables listed previously, you add the Products and Order Details tables.
-
Double-click the table fields that you want to use in your query.
As a rule, you add only the group field and the value field to the query. However, you can use a calculation instead of a value field — the next steps explain how to do so.
-
Add the Category field from the Products table to the design grid.
-
Create the column that calculates the sales amount for each transaction by typing the following expression in the second column in the grid:
Total Sales Value: (1-[Order Details].[Discount]/100)*([Order Details].[Unit Price]*[Order Details].[Quantity])
Make sure that the fields that you reference in the expression are of the Number or Currency data types. If you reference fields of other data types, Access displays the error message Data type mismatch in criteria expression when you try to switch to Datasheet view.
-
On the Query Design tab, in the Show/Hide group, click Totals.
The Total row appears in the design grid, and in that row, Group By appears in the first and second columns.
-
In the second column, change the value in the Total row to Sum. The Sum function adds the individual sales figures.
-
Click Run
-
Keep the query open for use in the next section.
Use criteria with a totals query
The query that you created in the previous section includes all the records in the underlying tables. It does not exclude any order when calculating the totals, and it displays the totals for all categories.
If you need to exclude some records, you can add criteria to the query. For example, you can ignore transactions that are less than $100 or calculate totals for only some of your product categories. The steps in this section explain how to use three types of criteria:
-
Criteria that ignore certain groups when calculating totals. For example, you will calculate totals for just the Video Games, Art and Framing, and Sports categories.
-
Criteria that hide certain totals after calculating them. For example, you can display only the totals greater than $150,000.
-
Criteria that exclude individual records from being included in the total. For example, you can exclude individual sales transactions when the value (Unit Price * Quantity) drops below $100.
The following steps explain how to add the criteria one by one and see the impact on the query result.
Add criteria to the query
-
Open the query from the previous section in Design view. To do so, right-click the document tab for the query and click Design View.
-or-
In the Navigation Pane, right-click the query and click Design View.
-
In the Criteria row of the Category ID column, type =Dolls Or Sports or Art and Framing.
-
Click Run
-
Switch back to Design view and, in the Criteria row of the Total Sales Value column, type >100.
-
Run the query to see the results, and then switch back to Design view.
-
Now add the criteria to exclude individual sales transactions that are less than $100. To do this, you need to add another column.
Note: You cannot specify the third criteria in the Total Sales Value column. Any criteria that you specify in this column applies to the total value, not to the individual values.
-
Copy the expression from the second column to the third column.
-
In the Total row for the new column, select Where and, in the Criteria row, type >20.
-
Run the query to see the results, and then save the query.
Note: The next time you open the query in Design view, you might notice slight changes in the design grid. In the second column, the expression in the Field row will appear enclosed inside the Sum function, and the value in the Total row displays Expression instead of Sum.
Total Sales Value: Sum((1-[Order Details].Discount/100)*([Order Details].Unitprice*[Orde r Details].Quantity))
You will also see a fourth column. This column is a copy of the second column, but the criteria that you specified in the second column actually appears as part of the new column.
-
Sum data across multiple groups by using a crosstab query
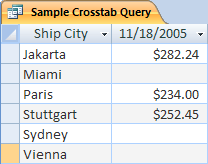
A crosstab query is a special type of query that displays its results in a grid similar to an Excel worksheet. Crosstab queries summarize your values and then group them by two sets of facts — one set down the side (a set of row headers), and the other across the top (a set of column headers). This figure illustrates part of the result set for sample crosstab query:
As you proceed, remember that a crosstab query does not always populate all the fields in the result set because the tables that you use in the query do not always contain values for every possible data point.
When you create a crosstab query, you typically include data from more than one table, and you always include three types of data: the data used as row headings, the data used as column headings, and the values that you want to sum or otherwise compute.
The steps in this section assume the following tables:
The Orders table
|
Order Date |
Ship Date |
Ship City |
Shipping Fee |
|---|---|---|---|
|
11/14/2005 |
11/15/2005 |
Jakarta |
$55.00 |
|
11/14/2005 |
11/15/2005 |
Sydney |
$76.00 |
|
11/16/2005 |
11/17/2005 |
Sydney |
$87.00 |
|
11/17/2005 |
11/18/2005 |
Jakarta |
$43.00 |
|
11/17/2005 |
11/18/2005 |
Paris |
$105.00 |
|
11/17/2005 |
11/18/2005 |
Stuttgart |
$112.00 |
|
11/18/2005 |
11/19/2005 |
Vienna |
$215.00 |
|
11/19/2005 |
11/20/2005 |
Miami |
$525.00 |
|
11/20/2005 |
11/21/2005 |
Vienna |
$198.00 |
|
11/20/2005 |
11/21/2005 |
Paris |
$187.00 |
|
11/21/2005 |
11/22/2005 |
Sydney |
$81.00 |
|
11/23/2005 |
11/24/2005 |
Jakarta |
$92.00 |
The Order Details table
|
Order ID |
Product Name |
Product ID |
Unit Price |
Quantity |
Discount |
|---|---|---|---|---|---|
|
1 |
Build Your Own Keyboard |
12 |
$77.95 |
9 |
5% |
|
1 |
Bureaucrat non-action figure |
2 |
$78.88 |
4 |
7.5% |
|
2 |
Exercise for Computer Geeks! The DVD! |
7 |
$14.88 |
6 |
4% |
|
2 |
The Magical Computer Chip |
4 |
$32.65 |
8 |
0 |
|
2 |
Computer Geeks and Mythical Creatures |
6 |
$78.50 |
4 |
0 |
|
3 |
Access! The Game! |
5 |
$22.95 |
5 |
15% |
|
4 |
Programmer Action Figure |
1 |
$12.95 |
2 |
6% |
|
4 |
Ultimate Flying Pizza |
8 |
$36.75 |
8 |
4% |
|
5 |
External 5.25-inch Floppy Diskette Drive (1/4 Scale) |
9 |
$65.00 |
4 |
10% |
|
6 |
Relational Database Diagram |
3 |
$22.50 |
12 |
6.5% |
|
7 |
Gloom |
11 |
$53.33 |
6 |
8% |
|
7 |
Relational Database Diagram |
3 |
$22.50 |
4 |
9% |
The following steps explain how to create a crosstab query that groups total sales by city. The query uses two expressions to return a formatted date and a sales total.
Create a crosstab query
-
On the Create tab, in the Queries group, click Query Design.
-
Double-click the tables that you want to use in your query.
Each table appears as a window in the upper section of the query designer.
If you use the sample tables, double-click the Orders table and the Order Details table.
-
Double-click the fields that you want to use in your query.
Each field name appears in the a blank cell in the Field row of the design grid.
If you use the sample tables, add the Ship City and Ship Date fields from the Orders table.
-
In the next blank cell in the Field row, copy and paste or type the following expression: Total Sales: Sum(CCur([Order Details].[Unit Price]*[Quantity]*(1-[Discount])/100)*100)
-
On the Query Design tab, in the Query Type group, click Crosstab.
The Total row and the Crosstab row appear in the design grid.
-
Click the cell in the Total row in the City field and select Group By. Do the same for the Ship Date field. Change the value in the Total cell of the Total Sales field to Expression.
-
In the Crosstab row, set the cell in the City field to Row Heading, set the Ship Date field to Column Heading, and set the Total Sales field to Value.
-
On the Query Design tab, in the Results group, click Run.
The query results appear in Datasheet view.
Aggregate function reference
This table lists and describes the aggregate functions that Access provides in the Total row and in queries. Remember that Access provides more aggregate functions for queries than it does for the Total row.
|
Function |
Description |
Us e with the data type(s) |
|---|---|---|
|
Average |
Calculates the average value for a column. The column must contain numeric, currency, or date/time data. The function ignores null values. |
Number, Currency, Date/Time |
|
Count |
Counts the number of items in a column. |
All data types except complex repeating scalar data, such as a column of multivalued lists. For more information about multivalued lists, see the article Create or delete a multivalued field. |
|
Maximum |
Returns the item with the highest value. For text data, the highest value is the last alphabetic value — Access ignores case. The function ignores null values. |
Number, Currency, Date/Time |
|
Minimum |
Returns the item with the lowest value. For text data, the lowest value is the first alphabetic value — Access ignores case. The function ignores null values. |
Number, Currency, Date/Time |
|
Standard Deviation |
Measures how widely values are dispersed from an average value (a mean). For more information about using this function, see the article Display column totals in a datasheet. |
Number, Currency |
|
Sum |
Adds the items in a column. Works only on numeric and currency data. |
Number, Currency |
|
Variance |
Measures the statistical variance of all values in the column. You can use this function only on numeric and currency data. If the table contains less than two rows, Access returns a null value. For more information about variance functions, see the article Display column totals in a datasheet. |
Number, Currency |


