
Important: In Excel for Microsoft 365 and Excel 2021, Power View is removed on October 12, 2021. As an alternative, you can use the interactive visual experience provided by Power BI Desktop, which you can download for free. You can also easily Import Excel workbooks into Power BI Desktop.
Slicers are a kind of filter. Place a slicer on a sheet to filter all of the visualizations on the sheet at once. When you click an item in the slicer, all of the visualizations with related content are filtered by the item you select. Power View slicers act much like slicers in Power Pivot in Excel.

You can add more than one slicer to your report, and the filtering effects of all slicers are combined. Slicers filter each other.
-
Create a single-column table from any field that is an attribute, such as Name or Category, and not a numeric value.
You can use images in your data as slicers. Read more about using images in Power View. -
On the Design tab > Slicer.
The table is converted to a slicer.
-
Click a value in the slicer to filter the contents of the sheet or view. To select multiple values, hold the Ctrl key when you click.
-
To clear the slicer filter, hover over the slicer, and then click Clear Filter in the upper-right corner of the slicer.
Tip: . Select all except a certain set of values by resetting the filter with the button in the upper-right corner, and then using Ctrl + click to unselect specific values. This shows overall values excluding the unselected values
Note: Clicking values in a table that is not a slicer does not filter the report.
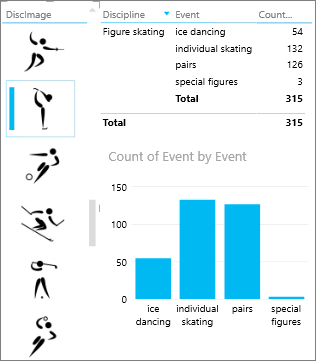
In this image, the Discipline Image slicer on the left is filtering for figure skating, so only figure skating data appear in the matrix and in the column chart on the right.
Filtering with a slicer is different from other types of filters. Slicers:
-
Filter charts. They do not highlight charts.
-
Are saved with the workbook or report. When you save, close, and reopen a workbook or report, the same values will be selected in the slicer.
-
Can use image fields. Behind the scenes, Power View uses the Row Identifier field for that image in the data model as the filter in the slicer. If the data model is in Excel, you may need to Configure table behavior properties for Power View reports.
See Also
Power View: Explore, visualize, and present your data
Power View and Power Pivot videos
Tutorial: PivotTable data analysis using a Data Model in Excel 2013


