
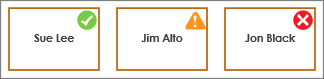
In Visio Professional, an icon set is a type of data graphic that can be applied after you import data to shapes in your drawing. The following example shows an icon set for the On track field for each of these three shapes:
Show conditions or "25%, 50%, 75% done ..."
Icon sets are good for showing conditions. For example, a green icon represents a shape that is in a good state, a yellow icon represents a partially good state, and a red light represents a concern.
Icon sets can also visualize data that is in percentages, amounts, or degrees. For example, different icons can represent 25% Done, 50% Done, 75% Done, 100% Done.
In addition, icon sets can simply represent data that is in Yes or No format, for example: On track, or Not on track.
Applying the icon set to shapes
-
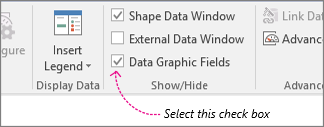
Make sure the Data Graphic Fields pane is open on the right. If it isn’t open, on the Data tab, click to select the Data Graphic Fields check box.
-
Do one of the following:
-
If you want to change all shapes on the page, click an empty space on the diagram to deselect any shapes that may be selected.
-
If you want to change only select shapes on the page, click one or more shapes to select them.
-
-
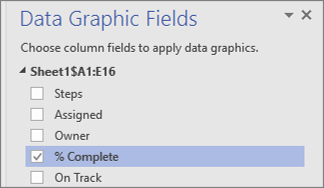
In the Data Graphic Fields pane, identify which field of data you want to change to an icon set.
-
In the same pane, make sure the field you want to change has a check mark, and make sure to select it so that it is highlighted in blue:
-
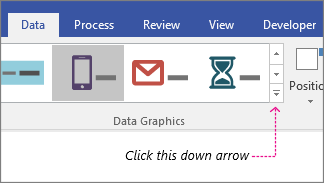
On the Data tab, click the down arrow at the bottom of the Data Graphic gallery.
-
Then choose an item under Icon Set.
Configuring other icon set properties
After applying an icon set, you may need to configure it so that the graphic visualizes your data properly. For example, you might want to change properties like text formatting, or you may want to position it differently.
-
Do steps 1-4 above.
-
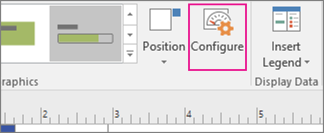
On the Data tab, click Configure.
-
If you want to change the overall look of the icon set, choose another style from the Style menu.
-
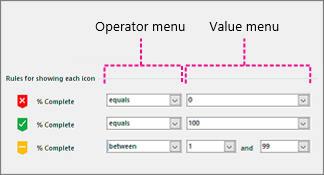
Look at the Rules section at the bottom. Each rule has two kinds of menus for each icon: The Operator menus and the Value menus.
-
If you don’t want an icon to appear at all, choose [Not Used] on the Operator menu for that icon.
-
For the icons that you do want to appear, fill out the Operator and Value menus.
-
Operator menu: This menu lets you use words and phrases that allow you to include or exclude certain values for the icon rule.
-
Value menu: This menu lets you set the value that the operator menu acts upon. You can specify a value yourself, or you can select a date from the calendar, enter your own custom formula expression, or choose a field in the diagram.
Notes:
-
The easiest way to complete this menu is to enter your own value directly. For example, in the above illustration, the icon set is representing the % Complete field. The first icon is a red icon, symbolizing a step in the flowchart that hasn’t had any work done yet. Therefore, the operator menu is set to equals, and the value is set to 0. If you were to speak the rule aloud you would say, “In order for the red icon to appear, the data must equal zero.” The second icon is a green icon, and is very similar except that its value is set to 100, representing completion.
-
The third icon is a yellow icon, symbolizing a step that is partially complete. Therefore, the operator menu is set to between, and the values are set to 1 and 99. If you were to speak the rule aloud, you would say, “In order for the yellow icon to appear, the data must be between 1 and 99.”
-
-
-
You can also reposition your data graphics.


