
-
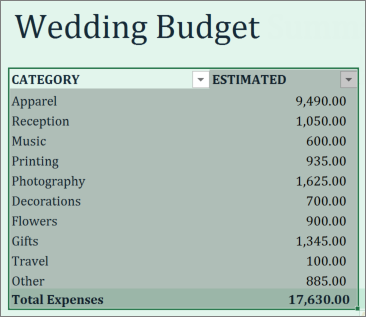
Select your data range. The following example shows data from two columns have been selected for the chart.
-
Click Insert > Recommended Charts .
Where is it?
-
Select the type of chart you want and click OK.
Create a chart


Need more help?
Want more options?
Explore subscription benefits, browse training courses, learn how to secure your device, and more.


Communities help you ask and answer questions, give feedback, and hear from experts with rich knowledge.


