
The names of data series in apps for Office are typically linked to the worksheet data that's used for the chart, and changes you make to that data are automatically shown in the chart. If you want to rename an existing data series or change the values without changing the data on the worksheet, do the following:
-
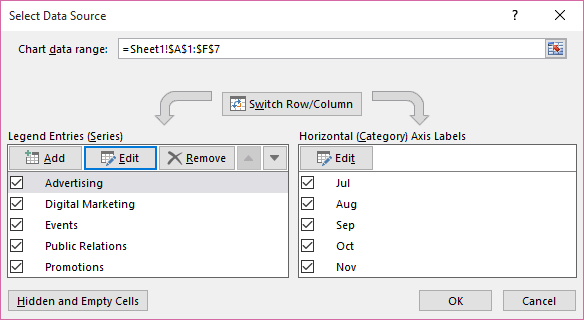
Right-click the chart with the data series you want to rename, and click Select Data.
-
In the Select Data Source dialog box, under Legend Entries (Series), select the data series, and click Edit.
-
In the Series name box, type the name you want to use.
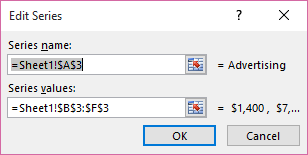
The name you type appears in the chart legend, but won't be added to the worksheet.
-
To change the data range for the data series, in the Series values box, type a data range for the data series or enter the values you want.
The values you type will appear in the chart, but won't be added to the worksheet.
Note: An xy (scatter) has a Series X values and Series Y values box, and a bubble chart has a Series X values, Series Y values, and Series bubble sizes box. You can change the data range for each of those values.


