
Note: This article has done its job, and will be retiring soon. To prevent "Page not found" woes, we're removing links we know about. If you've created links to this page, please remove them, and together we'll keep the web connected.
Usually, moving a chart (or any image, really) is as simple as dragging it with your mouse. Unfortunately, sometimes that doesn’t work. Sometimes, moving a chart does things you didn’t want to the text around it.
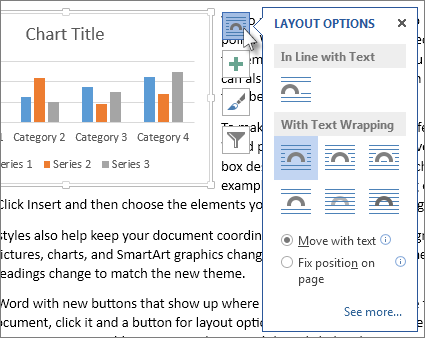
The key to getting the results you want is to click the Layout Options button:
-
Click View > Print Layout.
-
Click the chart.
-
Click the Layout Options button.
-
Choose the layout options you want.
By default, Word inserts new charts “in line with text.” This means that Word treats the chart like a (big) piece of text. Deleting or adding text to the left of the chart moves the chart left or right, just like a piece of text. Word even increases the line height for you so the chart won’t get cut off.
If In Line with Text isn’t doing what you want, choose one of the options under With Text Wrapping. For example, if you want the chart to appear by itself between lines of text, choose the Top and Bottom option.
After choosing an option under With Text Wrapping, you can choose what the chart should do if you add or delete text. Choose Move with text if you want the chart to move up or down the page as you delete or add text. Or, choose Fix position on page if you want the chart to stay at the same relative spot on the page.
Tip: To change the default layout for future charts, right-click the option you want, and then click Set as Default.
Can’t select the chart?
The chart is probably behind another object, like a block of text:
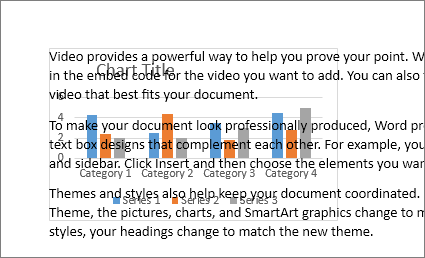
To select the chart, use the Selection pane:
-
Click Home > Select > Selection Pane.
-
In the Selection pane, click the chart.
Want more control?
For absolute control over the position of a chart, use the Layout box. This comes in handy when you want to place a chart a certain distance from something else, like a page margin.
-
Click the chart.
-
Click the Layout Options button.
-
Click See more.
-
Click the Text Wrapping tab, and then click any option exceptIn line with text.
For example, if you want your chart between lines of text, choose Top and bottom.
Or, if you want text to wrap around all sides of the chart, choose Square. -
Click the Position tab, and then enter the position you want.
Learn more
Word has a lot of options for controlling the placement of images. To learn more, read these excellent blog posts by the Word team:


