
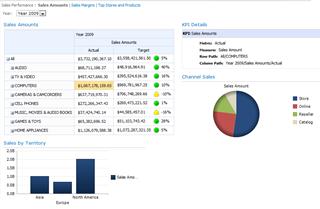
A dashboard is a related group of interactive scorecard and report views that are organized together in a SharePoint or Web-hosted site. A dashboard might resemble the following image:
SharePoint Server enables you to create and use dashboards that provide up-to-date information in a centrally managed, easily accessed location. You can use SharePoint Server tools to create and use dashboards that are suitable for an individual, team, group, or the entire organization.
What do you want to do?
Learn how to use a dashboard
Dashboards vary in design and complexity, but most dashboards tend to be highly interactive and enable you to explore data in individual reports and scorecards. You can start by viewing the information that is displayed in your dashboard, and then click on various items in the dashboard to apply filters or view higher or lower levels of information.
Use the following resources to learn how to use a dashboard:
Create a dashboard
Using Microsoft SharePoint Server 2010, you have several tools available to create dashboards. For example, you can create dashboards by using PerformancePoint Dashboard Designer, or by using SharePoint Server to create a Web Part page.
The tool that you select depends on several factors, such as user needs. For example, if you want to create a simple dashboard for an individual or a small group, you might want to create a Web Part page and add status indicators and a Chart Web Part to it. Or, if you want to create a robust dashboard that contains multiple scorecards, reports, and filters, you might want to create a PerformancePoint dashboard.
Use the following table to select the dashboard creation tool that meets your business needs:
|
Item |
Tool/Application |
Help Resources and Documentation |
|
A dashboard that contains one or more pages displaying a variety of reusable reports and information to be used across a large group or the entire organization. The dashboard can contain robust scorecards and reports, as well as display reports that are hosted on other servers. |
PerformancePoint Dashboard Designer |
|
|
An Excel workbook that contains one or more reports |
Excel Services |
|
|
A SharePoint page that contains one or more reports to be used by a team or a small group |
Web Part page |
|
|
An interactive chart that uses internal or external data to be displayed on a single SharePoint page |
Chart Web Part |
|
|
A simple scorecard or report that shows performance information for one or more metrics to be displayed on a single SharePoint page |
Status indicators |
|
|
A Visio diagram that is connected to data and that changes visually as the underlying data changes. |
Visio Web Access |
Add data-driven Web drawings to your dashboard with Visio Web Access |


